Elliott Wave Technical Analysis: Bitcoin, Tuesday, Aug. 29
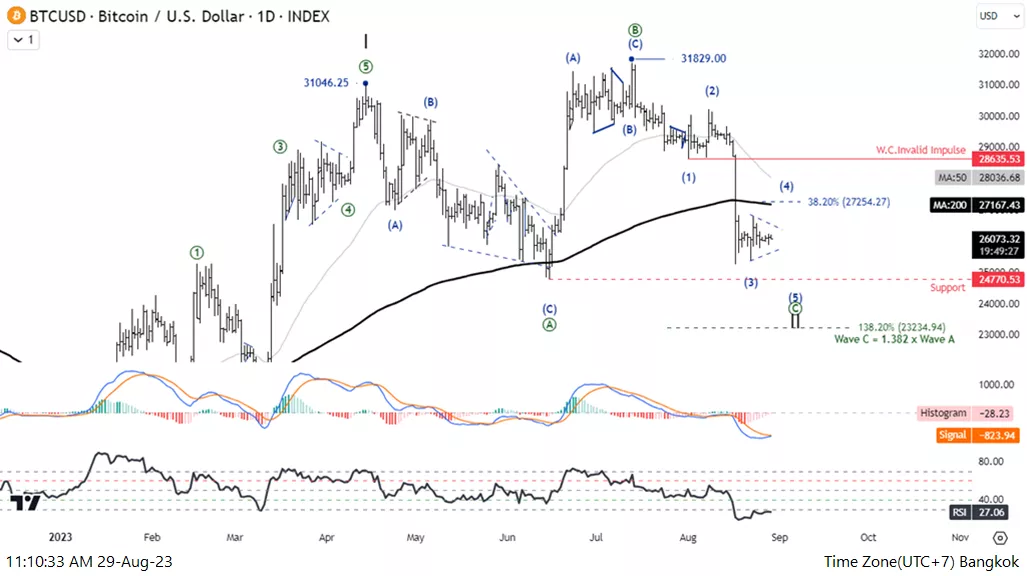
Elliott Wave Analysis TradingLounge Daily Chart, Monday, Aug. 29
Bitcoin/U.S. Dollar (BITCOMP) BTCUSD Elliott Wave Technical Analysis Function: Counter Trend Mode: Corrective Structure: Flat Position: Wave((C)) Direction Next higher Degrees: wave II of Motive Wave Cancel invalid level:
Bitcoin/U.S. Dollar (BTCUSD) Trading Strategy: A drop below 28639.62 broke the uptrend, causing the correction in wave 2 to not be completed, yet. Leads to a correction of the wave ((C)) in a flat pattern. Therefore, one will have to wait for the pattern to complete to consider joining the trend again.
Bitcoin/U.S. Dollar (BTCUSD) Technical Indicators: The price is below the MA200 indicating a Downtrend, MACD and RSI bearish momentum.
TradingLounge Analyst: Kittiampon Somboonsod, CEWA

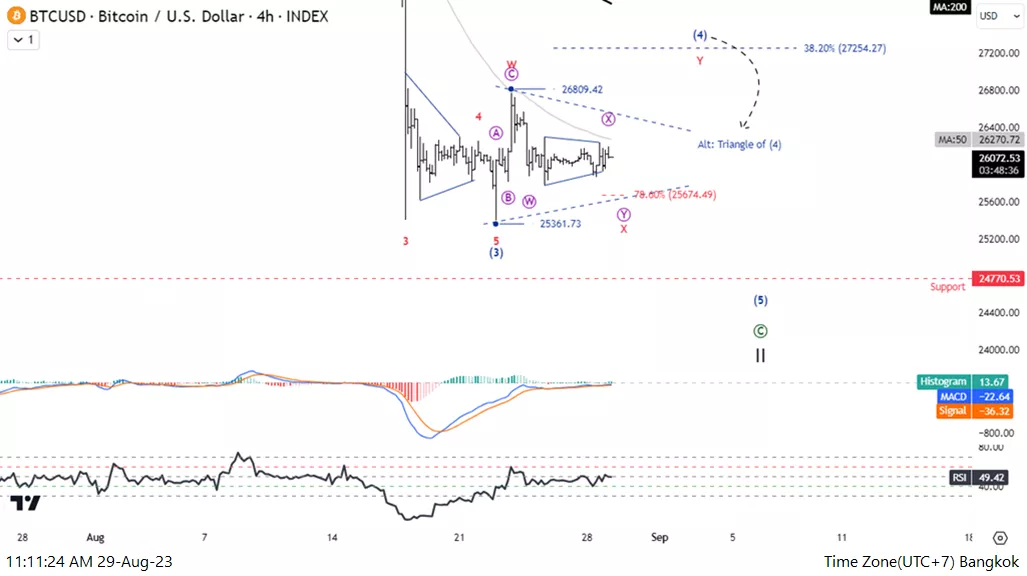
Elliott Wave Analysis TradingLounge 4H Chart, Monday, Aug. 29
Bitcoin/U.S. Dollar (BTCUSD) BTCUSD Elliott Wave Technical Analysis Function: Counter Trend Mode: Corrective Structure: ?? Position: Wave (4) Direction Next higher Degrees: wave (4) of Motive Wave Cancel invalid level.
Bitcoin/U.S. Dollar (BTCUSD) Trading Strategy: A drop below 28639.62 broke the uptrend, causing the correction in wave 2 to not be completed, yet. Leads to a correction of the wave ((C)) in a flat pattern. Therefore, one will have to wait for the pattern to complete to consider joining the trend again.
Bitcoin/U.S. Dollar (BTCUSD) Technical Indicators: The price is below the MA200 indicating a Downtrend, MACD and RSI bearish momentum.

More By This Author:
Commodities And Futures Trading Markets: Bonds, Dollar, Gold Silver, Copper...
Elliott Wave Technical Analysis: NEO/U.S. Dollar - Monday, August 28
Elliott Wave Technical Analysis: Intuit Inc. - Monday, August 28
Analyst Peter Mathers TradingLounge™ Australian Financial Services Licence - AFSL 317817


