
Intuit Inc., Elliott Wave Technical Analysis
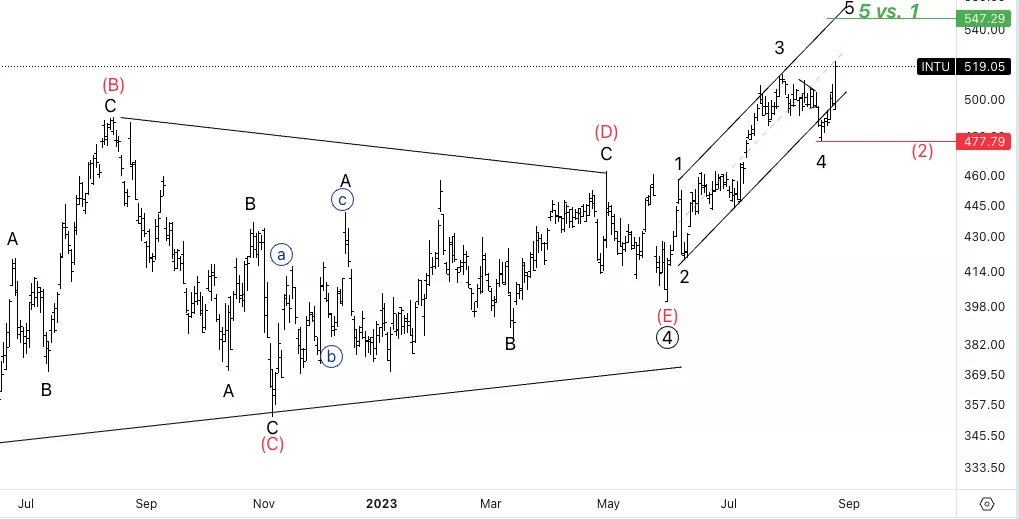
Intuit Inc., (INTU:NASDAQ): Daily Chart, 28 August 23
INTU Stock Market Analysis: We successfully moved as expected after we bottomed in Minor wave 4 after a clear 3 wave move to the downside, which is by definition corrective in nature. At this point we are looking for upside target for wave 5. Equality between 5 and 1 stands at 547$.
INTU Elliott Wave Count: Wave 5 of (1).
INTU Technical Indicators: Below all averages.
INTU Trading Strategy: Looking for longs into wave 5.
(Click on image to enlarge)
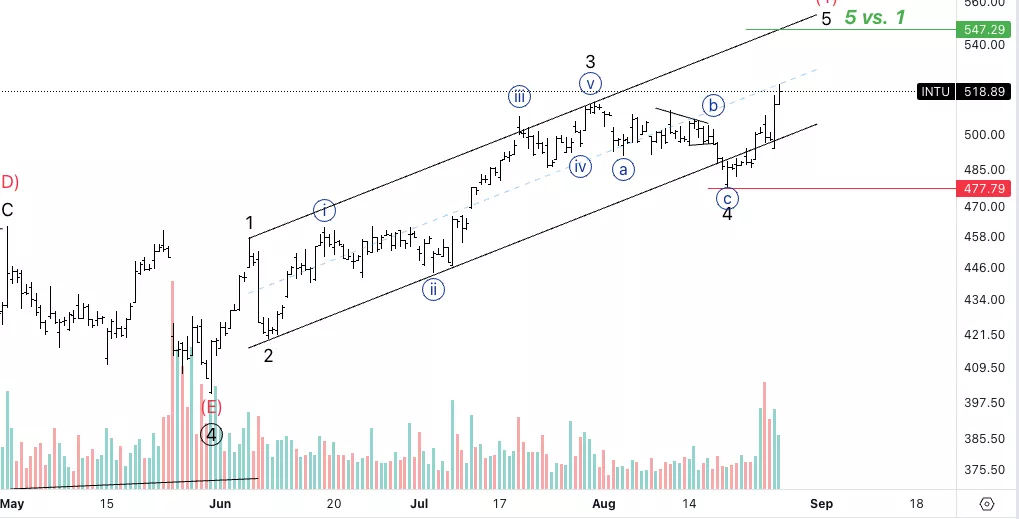
Intuit Inc., INTU: 4-hour Chart 28 August 23
Intuit Inc., Elliott Wave Technical Analysis
INTU Stock Market Analysis: We have invalidation at 477$, but a sharp and sudden move lower could mean the upside is completed. WE are seeing volume spiking just like we did at the end of the triangle in Primary wave 4 before the upside into this wave (1).
INTU Elliott Wave count: Wave 5 of (1).
INTU Technical Indicators: Below all averages.
INTU Trading Strategy: As we have an overlapping structure in wave 5 so far we oculd expect either an extension or a diagonal.
(Click on image to enlarge)
More By This Author:
Tech Stock Report: AAPL, AMZN, NVDA, TSLA, GOOGL, META, NFLX, MSFT - Aug. 27
Elliott Wave Technical Analysis Day Chart: U.S. Dollar/Japanese Yen - Friday, Aug. 25
Elliott Wave Technical Analysis: Binance Coin/U.S. Dollar - Friday, Aug. 25


Comments
Log in or sign up to join the conversation.