
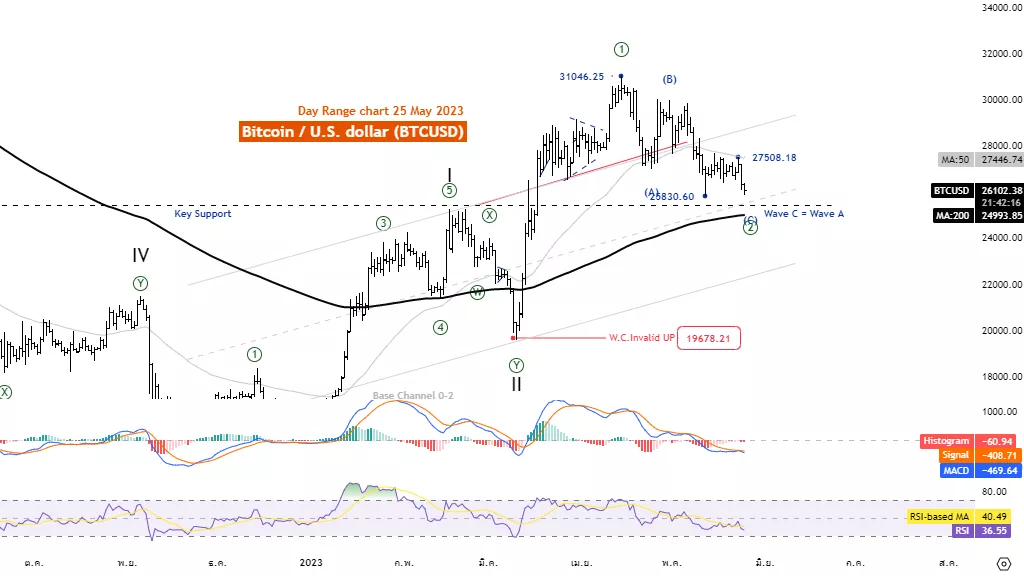
Elliott Wave Analysis TradingLounge Daily Chart, May 25

Bitcoin /U.S. Dollar (BITCOMP)
BTCUSD Elliott Wave Technical Analysis
Function: Reactionary(Counter Trend)
Mode: Corrective
Structure: Zigzag
Position: Wave(C)
Direction Next higher Degrees: wave ((2)) of Motive
Details: Wave decline ((2)) has an important support level at the level of 25431.
Wave Cancel invalid level: 19559.36
Bitcoin /U.S. Dollar (BTCUSD) Trading Strategy: Still in control of the bear market The price is likely to test the 200 MA line, in line with the ongoing correction of the wave ((2)).
Bitcoin /U.S. Dollar (BTCUSD)Technical Indicators: The price is above the MA200 indicating an Uptrend MACD and RSI are Bearish momentum.
TradingLounge Analyst: Kittiampon Somboonsod, CEWA
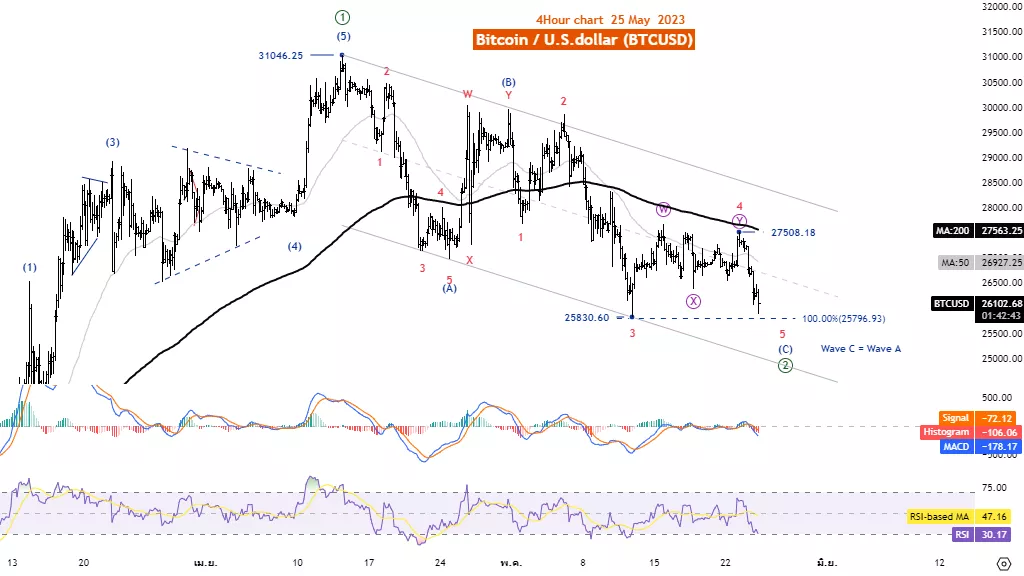
Elliott Wave Analysis TradingLounge 4H Chart, May 25
Bitcoin /U.S. Dollar (BTCUSD)
BTCUSD Elliott Wave Technical Analysis
Function: Reactionary(Counter Trend)
Mode: Corrective
Structure: Zigzag
Position: Wave(C)
Direction Next higher Degrees: wave ((2)) of Motive
Details: Wave C is equal to wave A at 25796.93
Wave Cancel invalid level: 19559.36.
Bitcoin /U.S. Dollar (BTCUSD) Trading Strategy: Still in control of the bear market The price tends to go down. Correspondingly, the price is below the MA 200 line and the wave correction ((2)) has not yet ended.
Bitcoin /U.S. Dollar (BTCUSD) Technical Indicators: The price is below the MA200 indicating a downtrend MACD and RSI are Bearish momentum.
More By This Author:
Elliott Wave Analysis: Nasdaq, NYSE, Technology Stocks And More
Elliott Wave Technical Analysis: Monster Beverage, May 24
NEOUSD Elliott Wave Technical Analysis - Wednesday, May 24


Comments
Log in or sign up to join the conversation.