

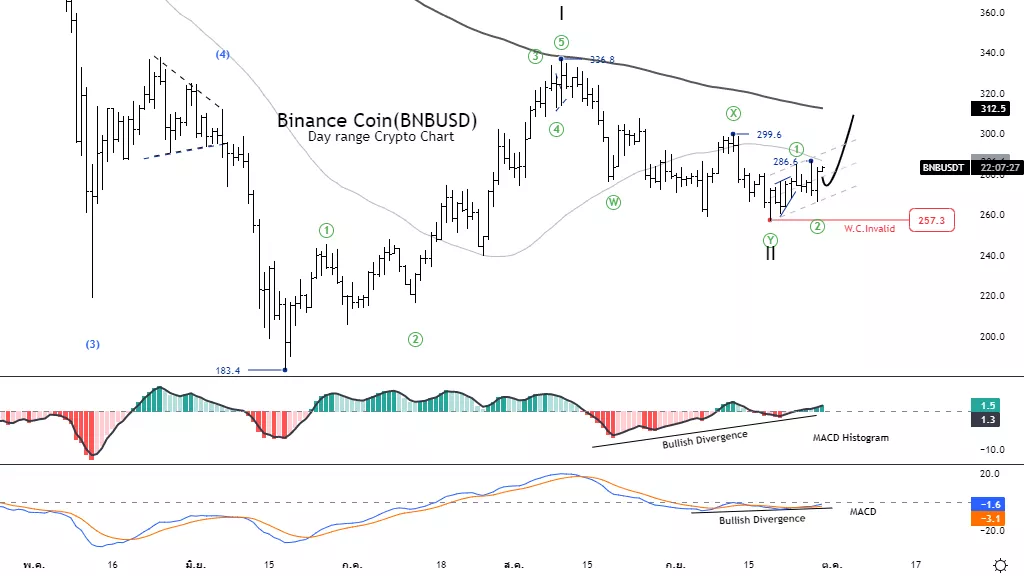
Elliott Wave Analysis TradingLounge Daily Chart, 29 September 2022, Binance Coin(BNB-X)

BNBUSD Elliott Wave Technical Analysis
Function: Follow trend
Mode: Motive
Structure: Impulse
Position: Wave ((3))
Direction Next higher degrees: Wave III of Motive Details: Wave II may have finished and the price is rising on wave III.
Wave Cancel invalid level: 257.3
Binance Coin(BNBUSD) Trading Strategy: Bull Market Efforts The price tends to trade above the 326.8 level, and it This could be an opportunity to open a long
position, but must not return below 257.3.
Binance Coin(BNBUSD)Technical Indicators: MACD and MACD Histogram has a Bullish divergence, and the price has an opportunity reversal.
TradingLounge Analyst: Kittiampon Somboonsod
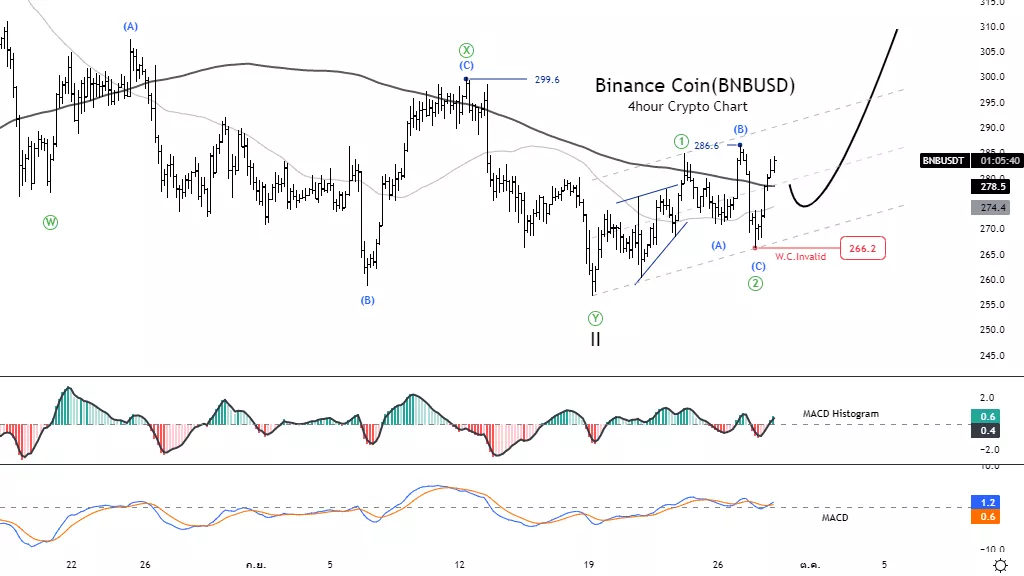
Elliott Wave Analysis TradingLounge 4H Chart, 29 September 2022, Binance Coin(BNBUSD)
BNBUSD Elliott Wave Technical Analysis
Function: Follow trend
Mode: Motive
Structure: Impulse
Position: Wave ((3))
Direction Next higher degrees: Wave III of Motive Details: Wave II may have finished and the price is rising on wave III.
Wave Cancel invalid level: 257.3
Binance Coin(BNBUSD) Trading Strategy: Bull Market Efforts The price tends to trade above the 326.8 level, and it This could be an opportunity to open a long position, but must not return below 2666.2.
Binance Coin(BNBUSD)Technical Indicators: The price is above the MA200, and MA50 line. MACD is above the zero line momentum is bullish.
More By This Author:
Elliott Wave Analysis: VeChain, Sept. 28
Elliott Wave Technical Analysis: Broadcom Inc., Sept. 28
Elliott Wave Analysis: What's Going On In The Markets?



Comments
Log in or sign up to join the conversation.