
Broadcom Inc., Elliott Wave Technical Analysis
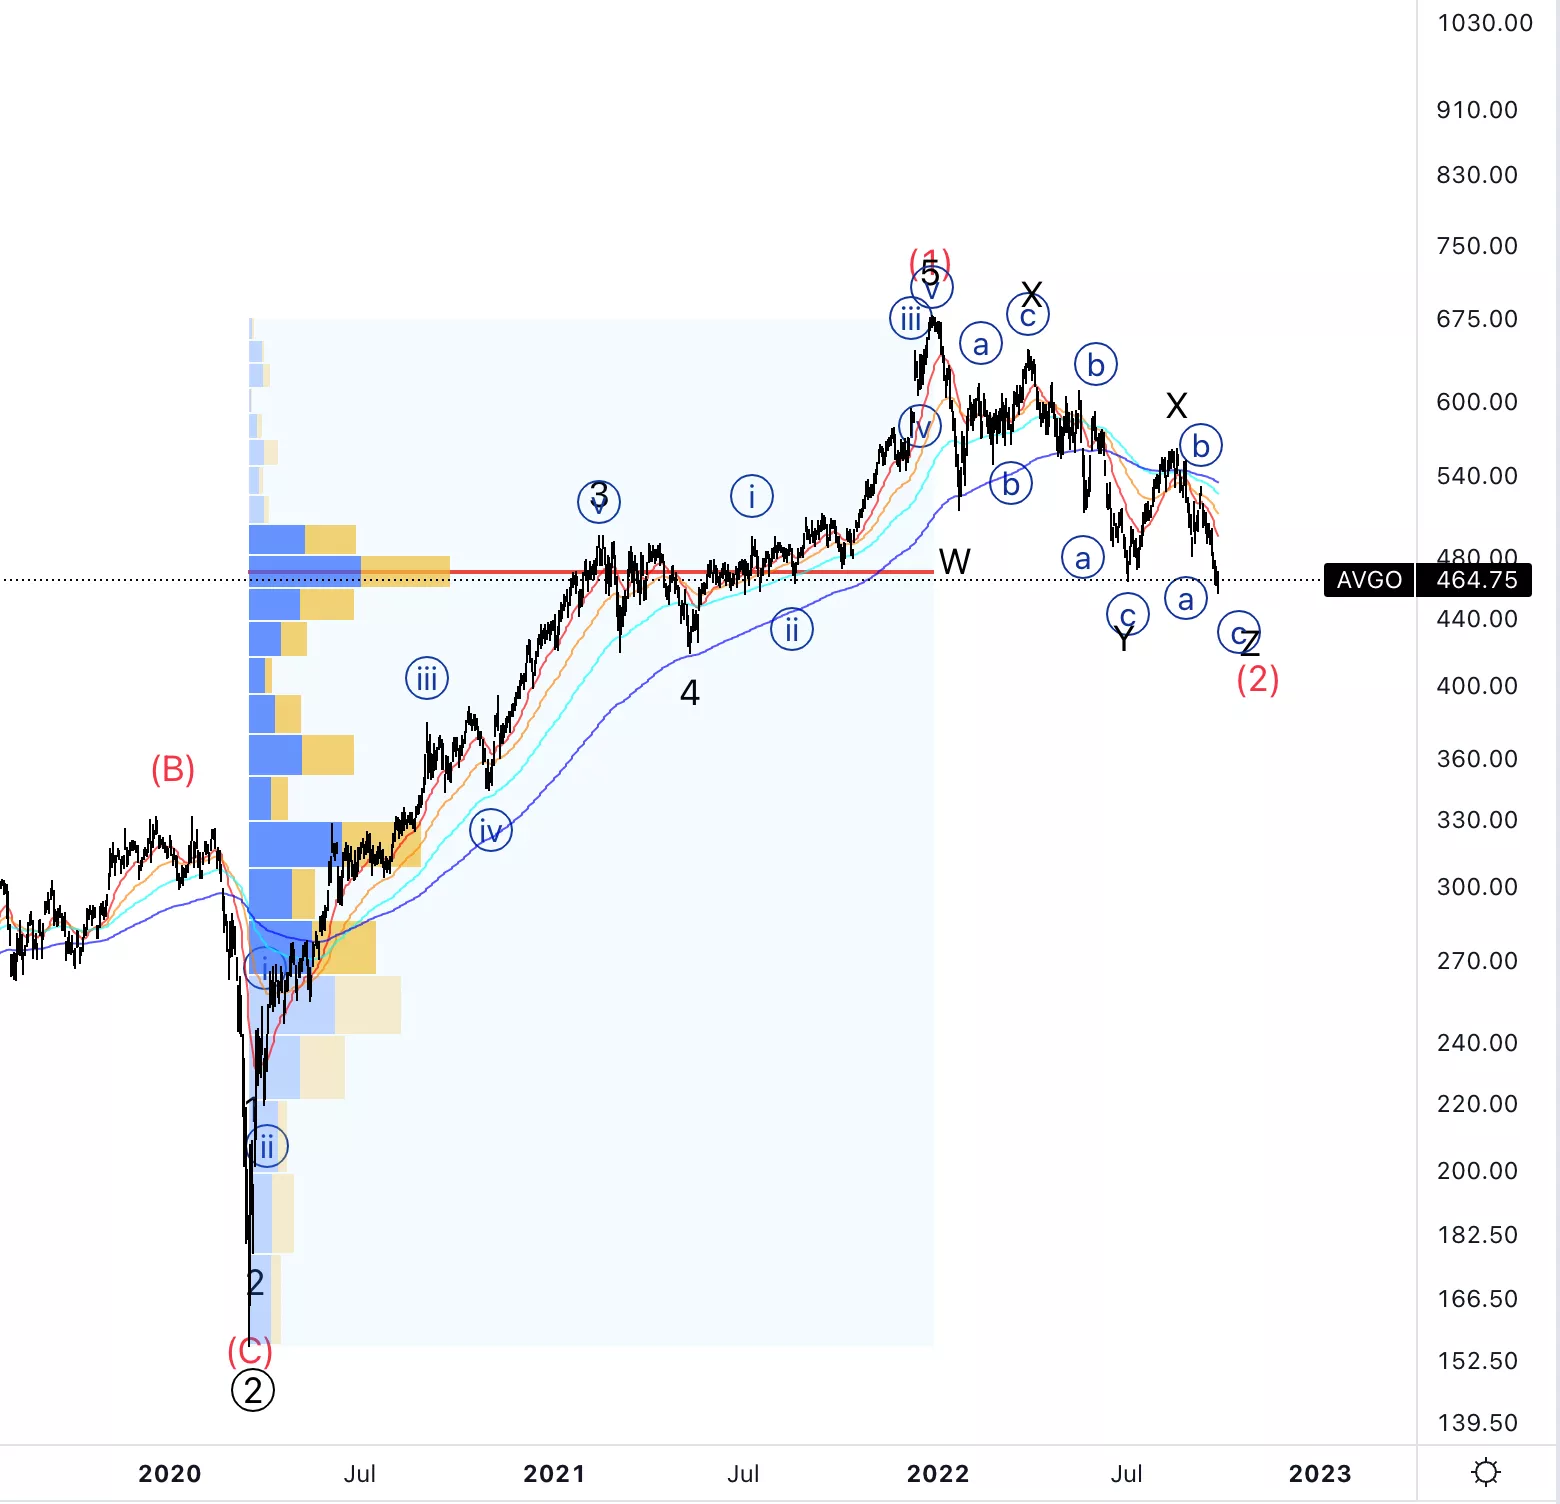
Broadcom Inc., (AVGO): Daily Chart, September 28 2022,
AVGO Stock Market Analysis: I wanted to zoom out to show you how we are approaching the volume point of control off the entire rally from the Covid-19 lows.
AVGO Elliott Wave count: Z of (2).
AVGO Trading Strategy: Looking for a clear sign of upside resumption to then place long term trades.
AVGO Technical Indicators: We have been in oversold territory for a while now so this could become interesting to buy in the future.
TradingLounge Analyst: Alessio Barretta
Source Tradinglounge.com
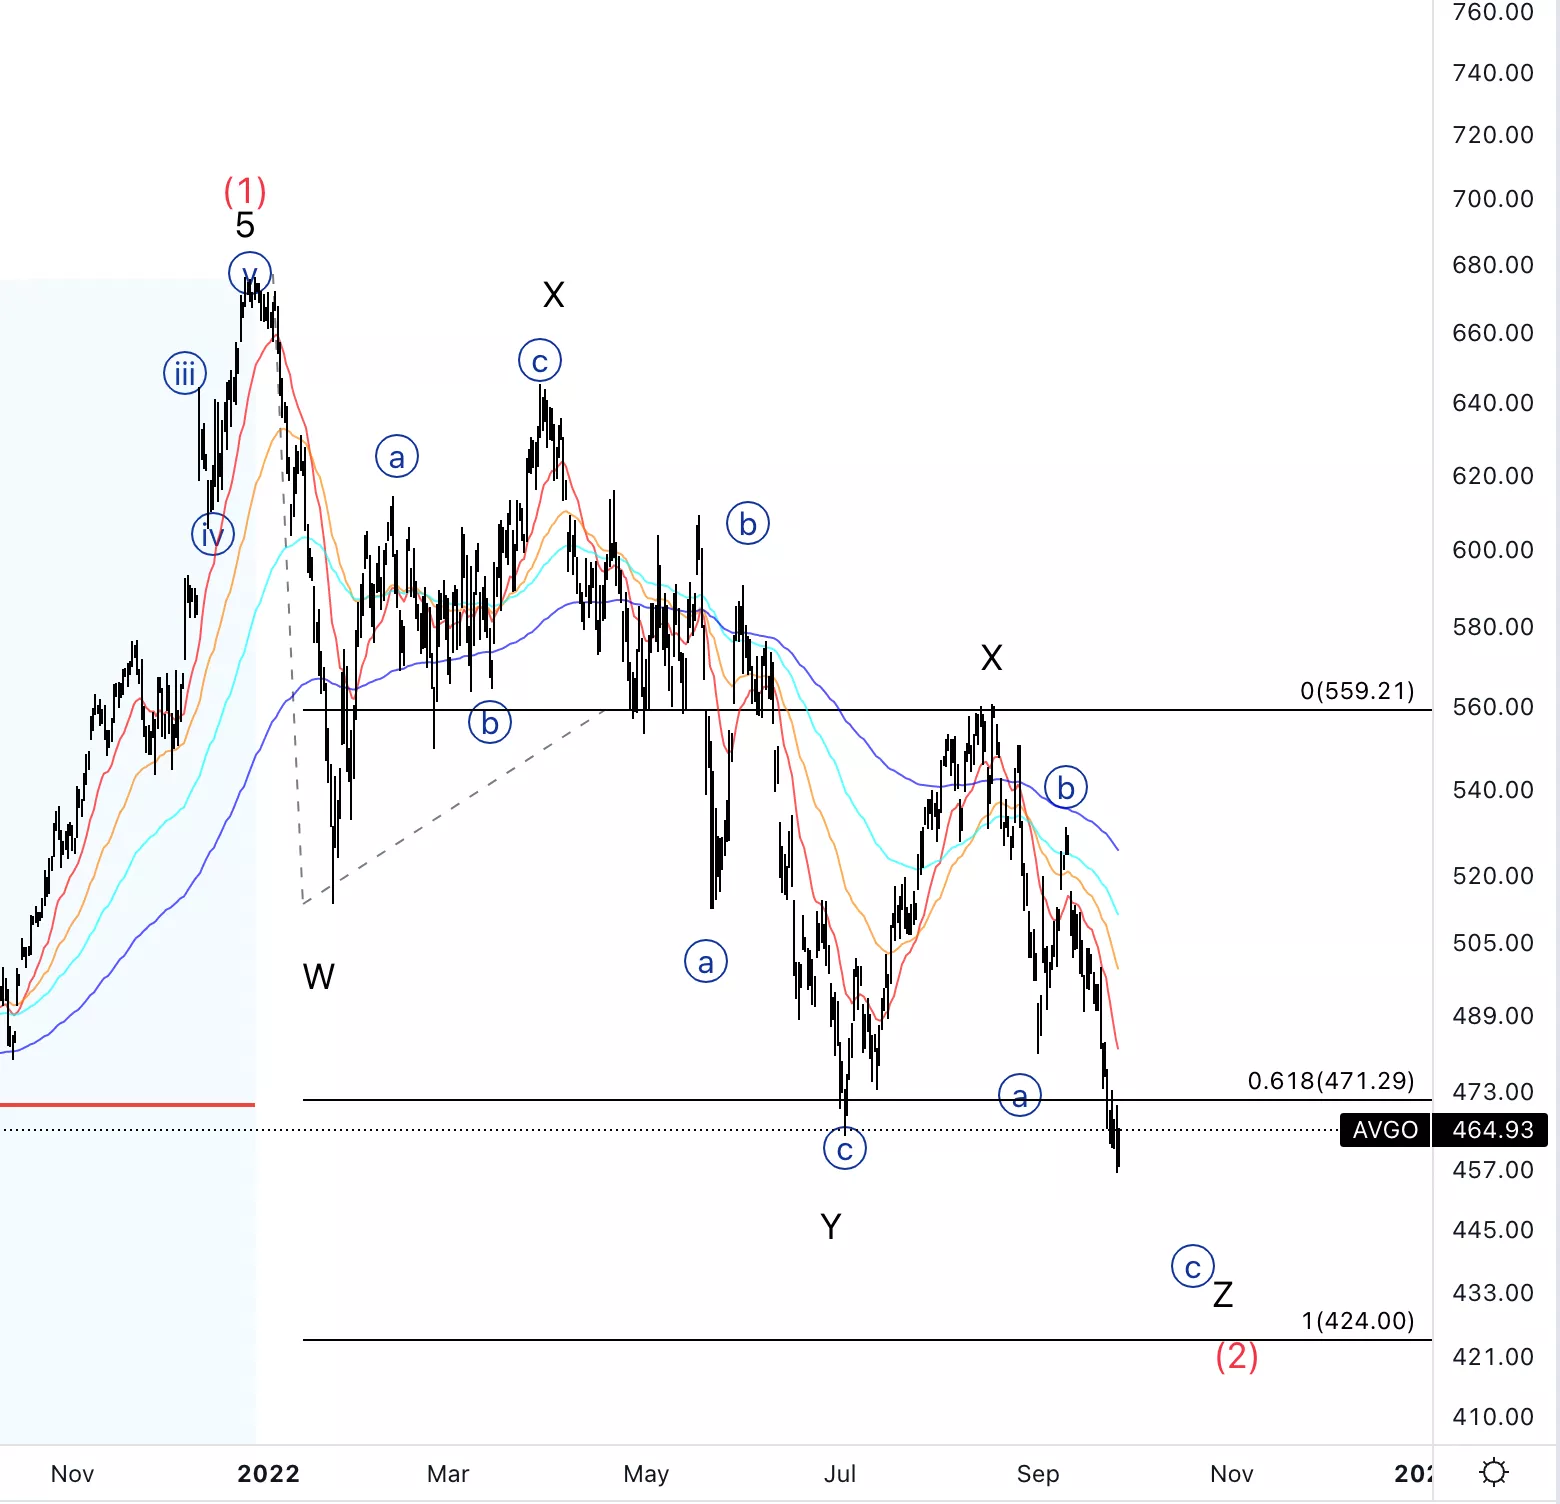
Broadcom Inc., AVGO: 4-hour Chart, September 28 2022
Broadcom Inc., Elliott Wave Technical Analysis
AVGO Stock Market Analysis: I would be looking for further downside as the move down in wave {c} does not seem complete. In addition to that we are lookin at equality of W and Z at 424$.
AVGO Elliott Wave count: {c} of Z.
AVGO Technical Indicators: Below all averages in oversold territory.
AVGO Trading Strategy: Looking for short term shorts, eventually using the 20 day EMA as resistance as long as every upside pullback is in a three wave nature.
More By This Author:
Elliott Wave Analysis: What's Going On In The Markets?
DAX 40 Index Chart And Forecasts Elliott Wave
CostCo Wholesale Corp.(COST:NASDAQ) Elliott Wave Technical Analysis September 27 2022


Comments
Log in or sign up to join the conversation.