
Cost Co Wholesale Corp., Elliott Wave Technical Analysis
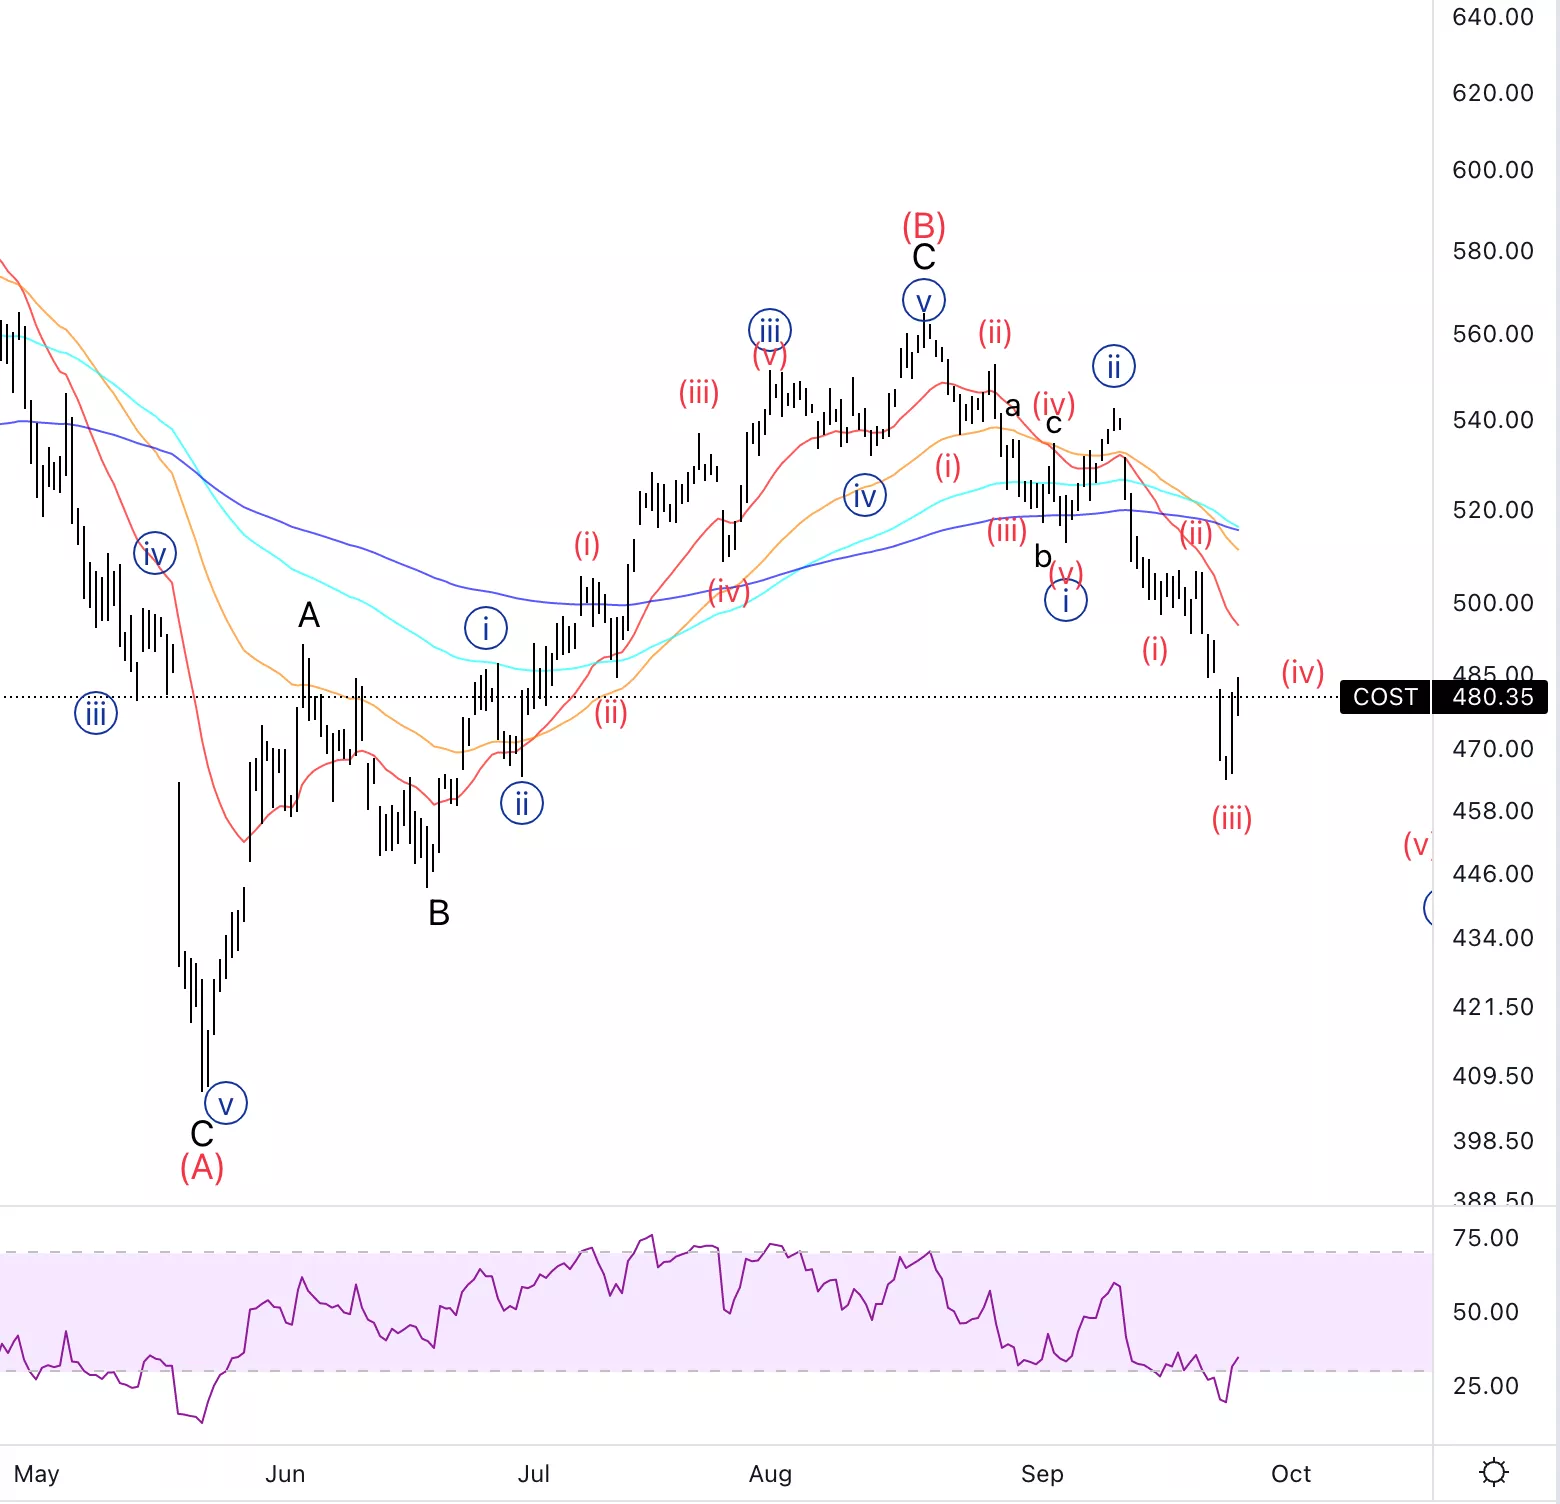
Cost Co Wholesale Corp.,(COST:NASDAQ): Daily Chart, September 27 2022,
COST Stock Market Analysis: Unfolding as predicted in the last forecast. Looking for continuation lower
COST Elliott Wave count: (iii) of {iii}
COST Trading Strategy: Looking to place shorts wave (iv) as well as any three wave upside move.
COST Technical Indicators: We are below the averages which could eventually turn out to act as resistance.
(Click on image to enlarge)

Cost Co Wholesale Corp., COST: 4-hour Chart, September 27 2022
Cost Co Wholesale Corp., Elliott Wave Technical Analysis
COST Stock Market Analysis: Looking for a pretty directional wave (iv) as wave (ii) was more of a sideways correction.
COST Elliott Wave count: (iii) of {iii}
COST Technical Indicators: The 20 EMA(red line) could keep acting as resistance.
COST Trading Strategy: Looking for short term shorts, eventually using the 20EMA as resistance.
(Click on image to enlarge)
More By This Author:
Bitcoin Elliott Wave BTC Bounce To $21,000 - Tradinglounge
Ethereum(ETHUSD) Elliott Wave Technical Analysis 26 September 2022
SP500 Elliott Wave Analysis - Bear Market Corrective Rally Wave Iv)


Comments
Log in or sign up to join the conversation.