
Photo by Maxim Hopman on Unsplash
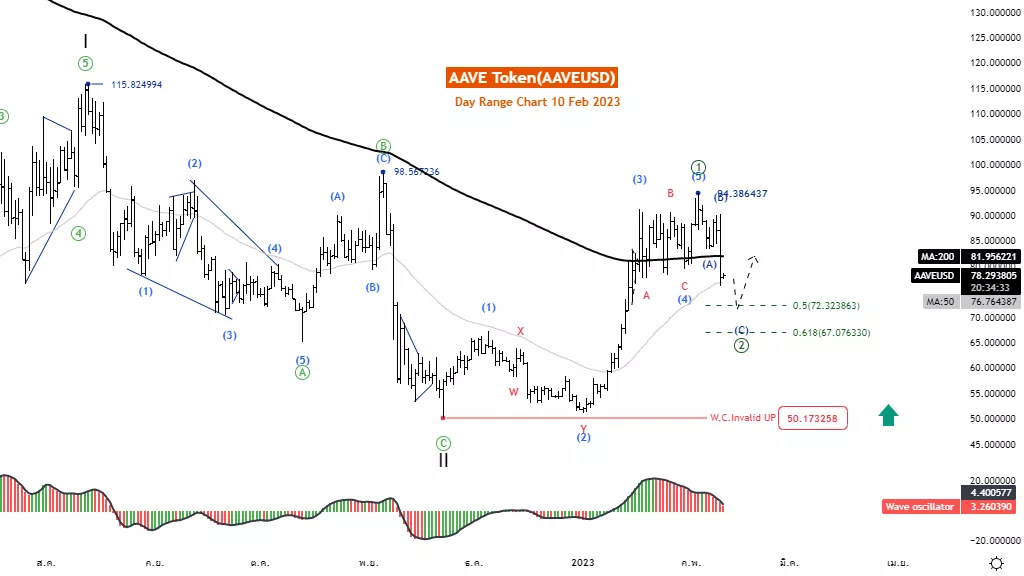
Elliott Wave Analysis TradingLounge Daily Chart, 10 February 2023.
AAVE / U.S. Dollar (AAVEUSD)
AAVEUSD Elliott Wave Technical Analysis
Function: Counter trend
Mode: Corrective
Structure: Zigzag
Position: Wave (C)
Direction Next higher Degrees: Wave ((2)) of Motive
Details: The retracement of wave 2 is usually .618 x the length of wave 1.
Wave Cancel invalid Level: 50.173
AAVE / U.S. Dollar (AAVEUSD) Trading Strategy: The AAVE token recovered well from the 50.40 level, but the price fell below the MA200 line, indicating that a downtrend is forming. Elliottwave structure is in a correction of wave (2), a short-term decline before the price. high up again Wait for wave 2 to finish to join the trend again.
AAVE / U.S. Dollar (AAVEUSD) Technical Indicators: The price is above the MA200 indicating a Down Trend. The wave oscillators above Zero-Line momentum are bullish.
Analyst: Kittiampon Somboonsod
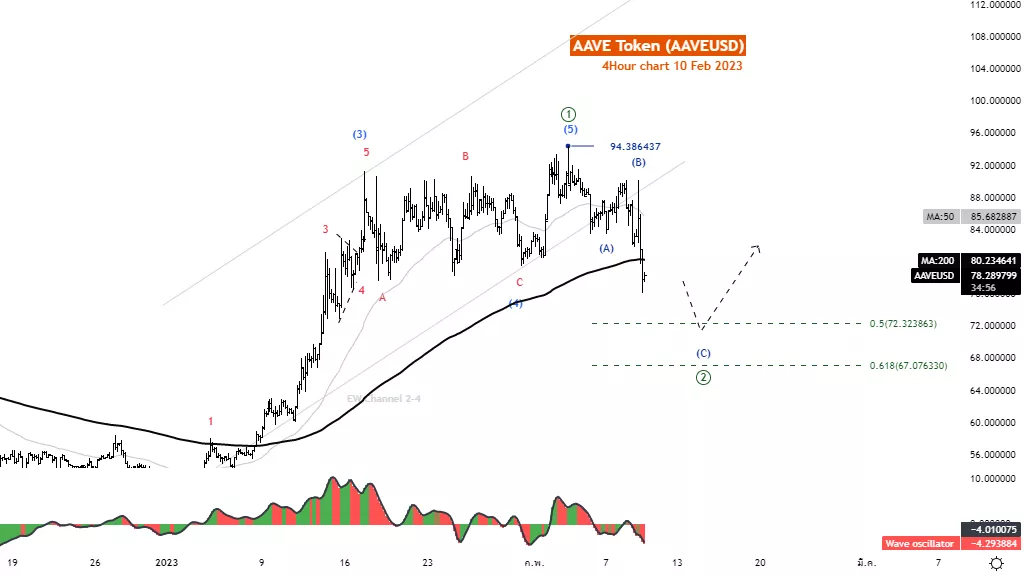
Elliott Wave Analysis TradingLounge 4H Chart, 10 February 2023.
AAVE / U.S. Dollar (AAVEUSD)
AAVEUSD Elliott Wave Technical Analysis
Function: Follow trend
Mode: Motive
Structure: Diagonal
Position: Wave (5)
Direction Next higher Degrees: wave ((1)) of Motive
Details: The fifth wave is the last wave in the sequence "5". Watch out for the pullback
Wave Cancel invalid level: 4.23
AAVE/ U.S. Dollar (AAVEUSD) Trading Strategy: The AAVE token recovered well from the 50.40 level, but the price fell below the MA200 line, indicating that a downtrend is forming. Elliottwave structure is in a correction of wave (2), a short-term decline before the price. high up againWait for wave 2 to finish to join the trend again.
AAVE / U.S. Dollar (AAVEUSD) Technical Indicators: The price is above the MA200 indicating a Down Trend. The wave oscillators above Zero-Line momentum are bearish.
More By This Author:
SP500 Elliott Wave Analysis - Wave 2 Correction
Elliott Wave Technical Analysis: Texas Instruments Inc. - Thursday, Feb. 9
Elliott Wave Technical Analysis: Polkadot / U.S. Dollar


Comments
Log in or sign up to join the conversation.