EJ Antoni On The Recession
of 2022H1, in light of his declaration of recession now. From August 1, 2022, from Heritage Explains episode “Biden’s Recession”:
In terms of how we define it or what marks a recession, the basic understanding is that when the economy shrinks for two consecutive quarters, so three months, and then another three months, that’s a recession. The reason that the White House has been making a lot of hay of, oh, that’s not official definition, blah, blah, blah. Okay. I suppose there is no technical official definition, but I’ve taught plenty of economics courses. That was what we used in every single class. That’s what you’ll see in most, if not all economics textbooks. That’s been the understanding for the last 100 years. So the idea that this is somehow new or not true, I dismiss that out of hand.
As it happens, this is what I wrote on that same day:
Note that these are “real time” data (i.e., what we actually knew at that time). While personal income was trending sideways, nonfarm payroll employment was rising strongly. Arguments that employment was actually falling seem in retrospect dubious (and even at the time).
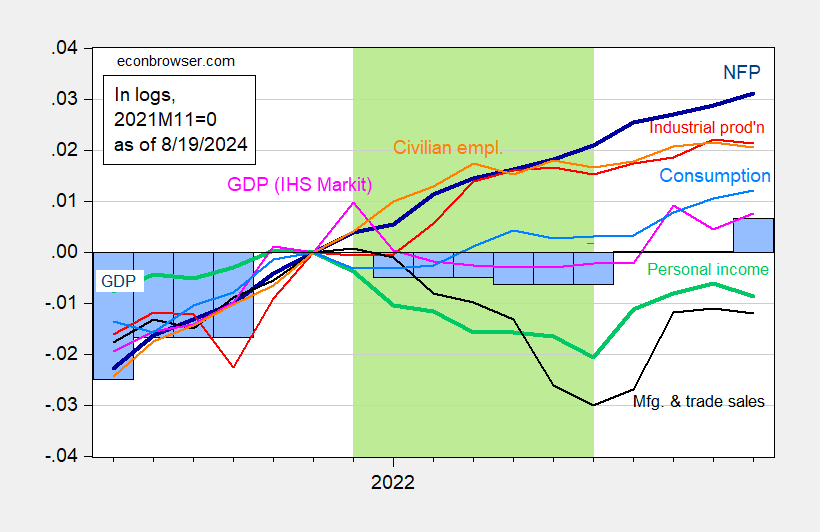
Here’s the current vintages picture of economic activity during this period.

Figure 2: Nonfarm payroll employment (bold dark blue), civilian employment (orange), industrial production (red), personal income excluding transfers in Ch.2017$ (bold green), manufacturing and trade sales in Ch.2017$ (black), consumption in Ch.2017$ (light blue), and monthly GDP in Ch.2017$ (pink), official GDP, 2024Q2 advance (blue bars), all log normalized to 2021M11=0. Hypothesized 2022H1 recession shaded light green. Source: BLS, Federal Reserve, BEA via FRED, IHS Markit (nee Macroeconomic Advisers) (8/1/2022 release), NBER, and author’s calculations.
Notice the contours look different for several series. This is a reminder that the data get revised.
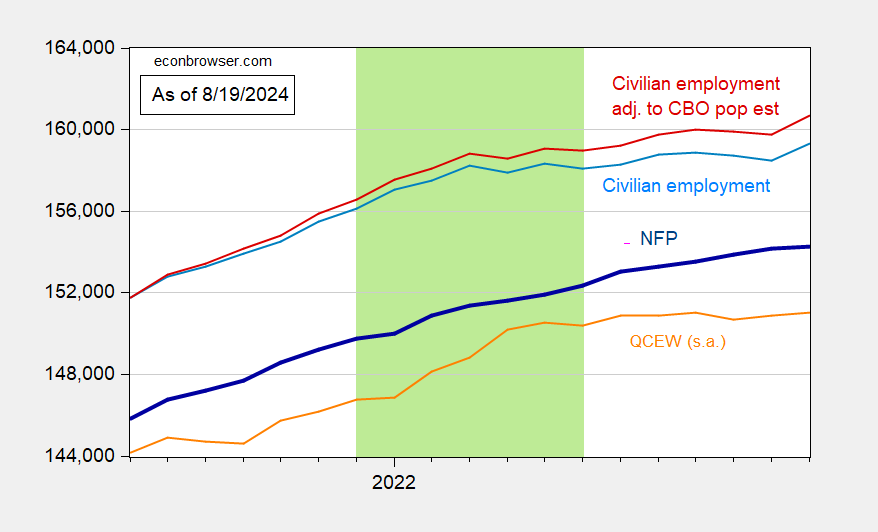
If you’re still worrying about NFP (birth-death model and all that stuff), remember there’s been a benchmark revision since the 2022 data. Here’s what the data look like now, for NFP, QCEW and population from the household survey.

Figure 3: Nonfarm payroll employment (bold blue), QCEW total covered employment (orange), civilian employment as reported (light blue), adjusted to add in extra 3.8 mn immigrants (red) (see text), all in 000’s, seasonally adjusted. QCEW seasonally adjusted by author using X-13 in logs. Hypothesized 2022H1 recession shaded light green. Source: BLS, Dallas Fed, and author’s calculations.
The calculation of the adjusted civilian employment series is reported in this post.
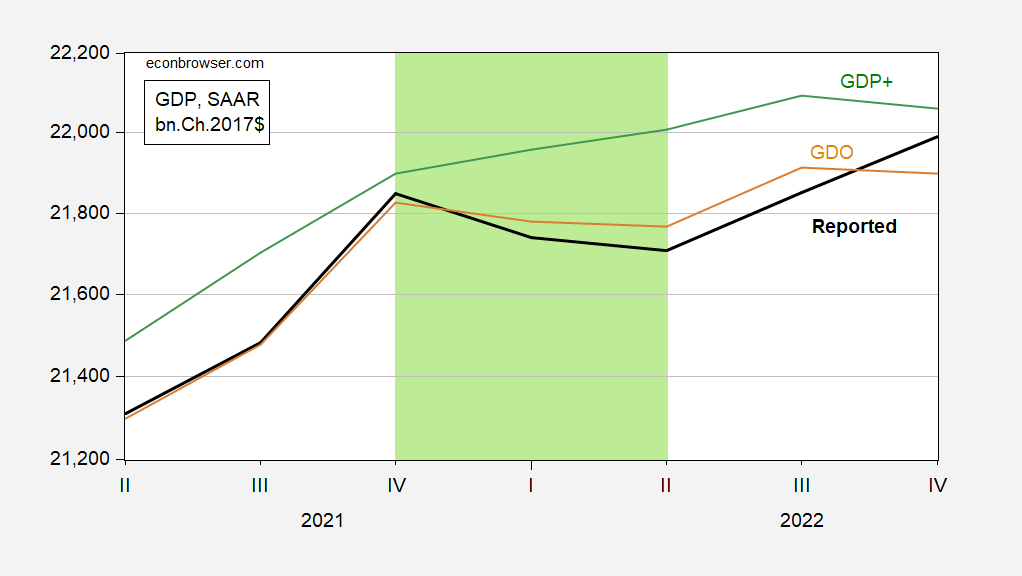
Dr. Antoni’s argument is focused on the two-quarter GDP rule-of-thumb. We know that GDP is subject to large revisions over time, so even if one hewed to the two-quarter rule-of-thumb, one could get different answers over time. GDO and GDP+ are alternative measures.

Figure 4: GDP (bold black), GDO (tan), and GDP+ (sky blue), all in bn.Ch.2017$ SAAR. GDP+ scaled to 2019Q4 GDP. Hypothesized 2022H1 recession shaded light green. Source: BEA, Philadelphia Fed, author’s calculations.
So, recession in 2022? I don’t think so. Finally, remember this assertion:
[The 2 consecutive quarter rule] was what we used in every single class. That’s what you’ll see in most, if not all economics textbooks. That’s been the understanding for the last 100 years.
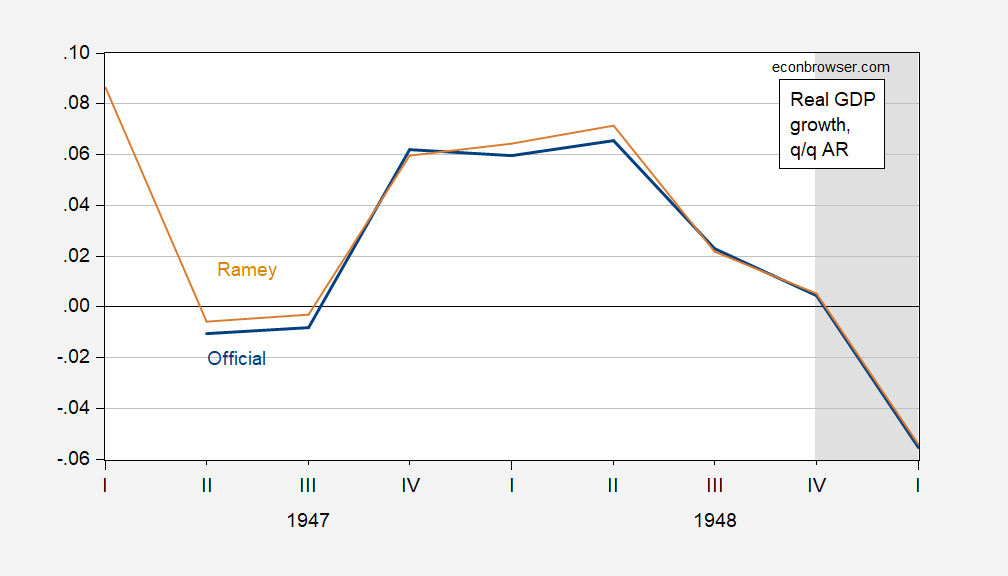
Not true in the textbooks I used. I don’t know what textbooks Dr. Antoni used. My suggestion. Look at the data, in particular, GDP growth over a longer span.

Figure 5: Quarter-on-Quarter real GDP growth annualized for official series (blue), and for Ramey series (tan). NBER defined peak-to-trough recession dates shaded gray. Source: BEA, Valerie Ramey, NBER, and author’s calculations.
Note NBER does not date a recession to 1947, when there were two consecutive quarters of negative growth.
More By This Author:
Grocery Prices And Wholesale Food Prices
Manufacturing Is In Recession
Food At Home CPI Component: Unchanged Relative To January 2024


