Holiday Insights: Turkeys, Snowflakes, And Economic Tipping Points
|
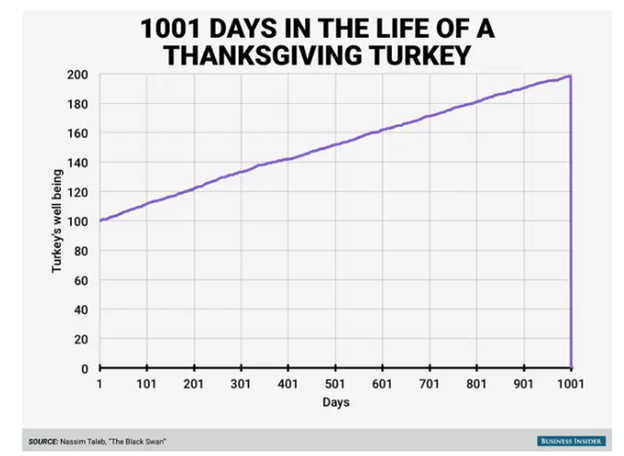
There’s a great parable I learned a few years ago while reading ‘The Black Swan’ by Nassim Taleb – the former investor turned author (which is a must read in the Speculators Anonymous Reading List). It’s also perfect for this time of the year. . . To give you some context – in his 2007 book – Taleb reminds us how truly difficult it is to predict the future based on past events. He calls this concept the black swan – an event or occurrence that’s so remote it’s completely unforeseen. We can have all the data, charts, and insights we’d like. But there’s always a potential situation that can throw a wrench in even the soundest of plans. Just think about COVID-19 or September 11th, 2001 or the Russia-Ukraine war. Sure, we could’ve noticed the tension (stress) building before these events. But forecasting the intensity, the exact time, and the unintended consequences from them? That was almost impossible (or rather, only in hindsight it may have seemed obvious). This is what Taleb means by black swans. And he puts this in an easy-to-understand parable. . . Taleb uses an example of a turkey on a farm. It hatched in December and grew up living a normal life in a pen. Eating plenty of corn and playing with other turkeys. And over time, the turkey became more and more complacent with its everyday life. Growing increasingly comfortable, fat, and satisfied. The turkey starts to believe that the “friendly humans” are there to look out for its best interest and happiness. But – little does it know – that each day that passes, it nears catastrophe. Because just as its comfort level peaks – Thanksgiving arrives. And that turkey is served for dinner. Or – put another way – just as the turkey was most complacent on that Wednesday night before Thanksgiving – its ultimate risk was at its absolute highest. |
|
|
|
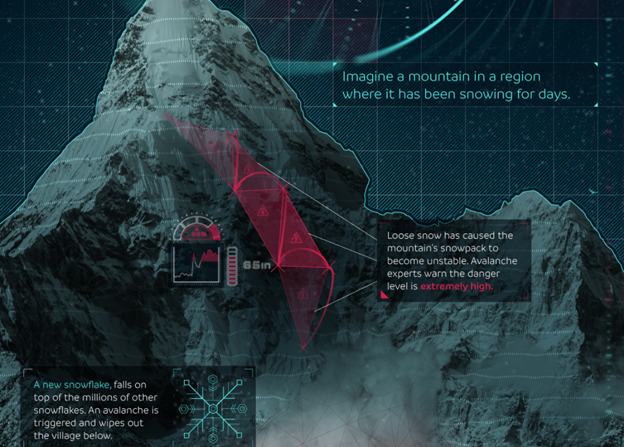
In fact, Taleb wrote, “Consider that [the turkey’s] feeling of safety reached its maximum when the risk [Thanksgiving] was at the highest!” Poor bird didn’t even realize what was coming. . . This parable is a poignant reminder about complacency and falling for recency bias when making forecasts or putting too much faith in models. “What’s the recency bias?” It’s essentially the tendency to overemphasize the importance of recent experiences or the latest information we possess when estimating future events. It isn’t that we can’t know or estimate the future, but that we delude ourselves into thinking we always can – thus creating a false sense of confidence. And – as we’ve seen in history – the more confident we feel, the more complacent we grow, and the more risk we may take on. Potentially leaving us like the turkey before Thanksgiving. So – in summary – beware of using the past to forecast the future; some things may only work until they don’t. Keep that in mind as you digest your leftover turkey. . . The Avalanche and the Nameless Snowflake: How It Ties To Markets What I love about markets and economics is that you can use other studies to gain insight and find an edge – whether it is physics and psychology or biology and accounting. It all matters. But one I found most useful in markets is the study of complex systems. Put simply, in contrast to the frequently employed ‘top-down’ method used to explain intricate concepts such as evolution, economics, or human behavior, complexity studies take a ‘bottom-up’ approach. Meaning they start by examining the behaviors and interactions of individual units within a complex framework. I know this may seem like a mouthful, but let me break it down in a fun way that you can relay to others. . . Imagine yourself perched on a mountainside, watching as the snow accumulates along the ridge. It’s an ongoing snowfall, and from the scene, it’s evident that an avalanche threat looms. The conditions are precarious—windy and unstable. Now, If you’re well-versed, you understand the imminent danger: a collapse that could spell disaster for skiers and the village below. In this setting, picture a single snowflake descending onto the already-settled snowpack. Its landing disrupts a few neighboring snowflakes, setting off a sequence as the few begin compounding and piling up with others. The disturbance spreads as the snow begins to shift and momentum gains – eventually hitting a tipping point that unleashes the entire mountain, burying the village below. The question arises: Who or what is to blame? Is it the fault of the single snowflake, or is it the unstable snowpack itself? My perspective veers away from blaming the individual snowflake. Why? Because had it not been this specific snowflake that caused the tipping point (aka the straw that broke the camel’s back), it could have been its predecessor, successor, or even one much later in the future. Thus, the issue lies in the instability of the entire system. |
|
|
|
Applying this analogy to financial risks, fixating on the ‘nameless snowflake’ — the catalyst — becomes inconsequential. A harmless lone snowflake, much like the majority, fail to incite a catastrophic chain reaction. Rather, it’s the initiation of this chain reaction, expanding exponentially – like a nuclear reaction – that poses the real threat. But, most neutrons don’t trigger such reactions. Just as most snowflakes don’t cause avalanches. Ultimately, it’s not about the individual snowflakes or neutrons. It’s about the initial critical conditions that set the stage for the possibility of a chain reaction or an avalanche. These conditions can be hypothesized and observed on a large scale, but the exact moment of the reaction remains unobservable due to its minute scale relative to the system. Hence, some liken these triggering events to ‘black swans’ (remember the above section of this piece?) Now, the snowflake and the avalanche is just a metaphor. However, the underlying mathematics remains consistent and ties into understanding markets. For example – according to the Bank of International Settlements (BIS) – there are over $630 trillion in over-the-counter (OTC) derivatives in global markets as of June 2022 (a derivative is a securitized contract whose value is dependent upon one or more underlying assets). To put this context, the total production of goods and services (i.e. GDP) worldwide in 2022 was $100 trillion. That means that there’s over 600% more financial derivatives than actual global output. . . Worse is that the $630 trillion of derivatives may be nestled off-balance sheets and constitute concealed liabilities within the global banking system. This derivative ‘snow pile’ holds the potential to become an avalanche due to its leveraged structure. Now, who knows what, when, or where the tipping point may be. But it’s something to keep in mind. One large seller or a steep loss in derivatives could potentially set off a chain reaction (just like how one new snowflake landing could trigger others around it to move, which triggers others to move, and on and on until the avalanche begins). I plan on writing more on these topics, so in the meantime – remember: Every disastrous avalanche started with just a single pretty snowflake. . . |
More By This Author:
U.S. Household Debt Woes: Loan Delinquencies Rise As Excess Savings EvaporateChina’s Deflation Problem: Impact On Companies, Local Governments, And Growth
Navigating The Soft Landing Mirage – These Key Indicators Reveal The Hidden Truth


