

Image Source: Pixabay
The Atlanta Fed Wage Growth Tracker (WGT) indicator of nominal pay growth over the past two years has increased, according to the Atlanta Fed. December 2022 saw a 6.1 percent increase. This number is substantially higher than the 3.6 percent average seen in 2019, prior to the COVID-19 epidemic, even though it is down from the peak of 6.7 percent reached in June and July of last year. Inflation has also been high at the same time. The consumer price index (CPI), for instance, grew by 6.5 percent between December 2021 and December 2022. The outcome was a real or inflation-adjusted WGT of -0.4% for December 2022.
Chart 1 displays the time series of the WGT and inflation to show how it has fared through time.
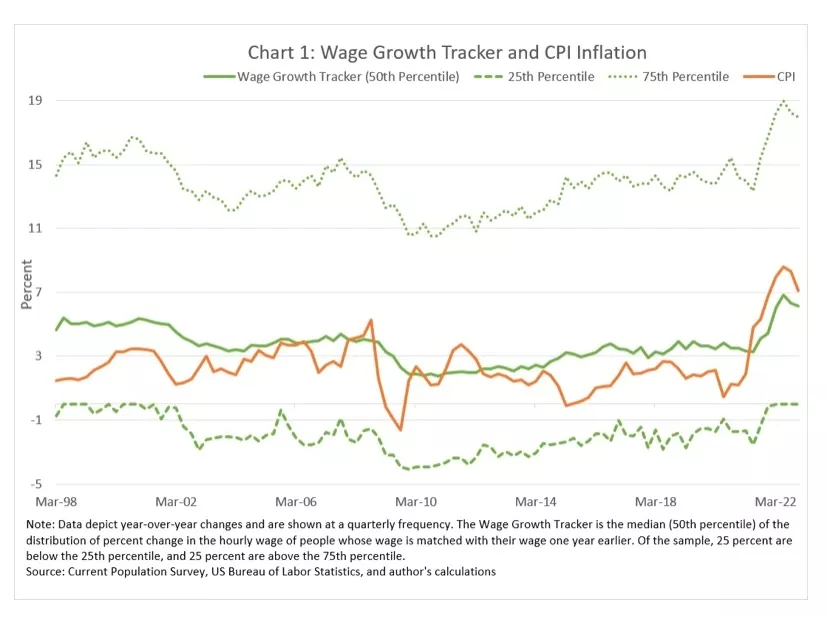
As you can see, for most of 2021 and 2022, the WGT's median pay increase was lower than the average rate of inflation.
Prior to that, the last time the actual WGT was negative was in 2011, a brief period when CPI inflation hit 4% and the WGT was essentially unchanged at roughly 2%.
The fact that the real WGT is negative indicates that, when compared to the CPI, less than half of the sample's population had real wage gains. However, as seen in chart 1, the distribution of pay increases across individuals varies significantly over time.
For instance, about 25% of the sample indicated nominal pay growth in 2022.
Chart 2: The percentage of the Wage Growth Tracker Sample that is higher than the CPI Inflation Rate
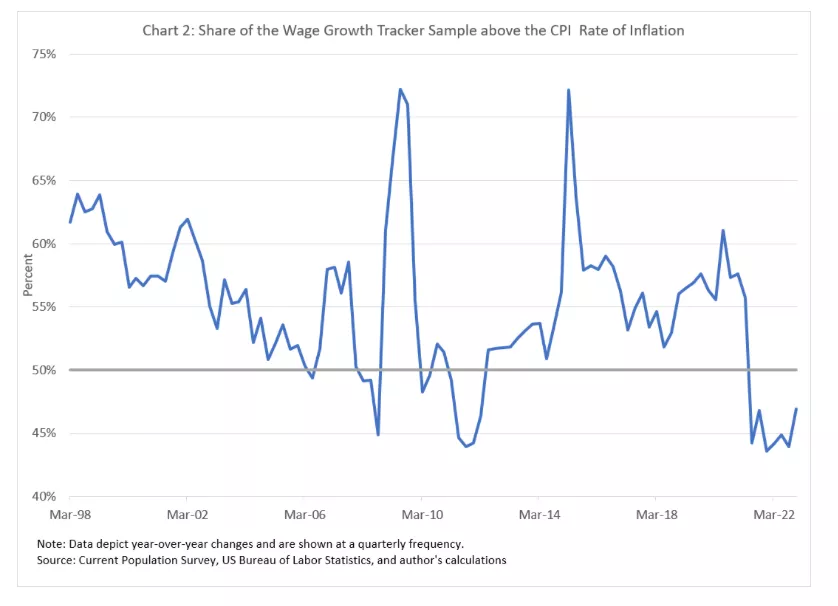
Data are displayed quarterly and illustrate changes from one year to the next. US Department of Labor Statistics, the Current Population Survey, and author calculations.
For instance, in the WGT sample, 57 percent of workers experienced positive real pay growth in 2019, but just 45 percent did so in 2022. In other words, despite higher median nominal income growth, between 2019 and 2022, a lower percentage of people saw positive real wage growth due to increased inflation.
As a straightforward counterfactual, close to 63 percent of persons would have had positive real nominal wage growth in 2022 if the rate of inflation had remained at its 2019 average level of 1.8 percent. That is, rather than a 12 percent fall in the proportion of workers experiencing real pay growth relative to 2019, a tight labor market without high inflation would have produced a 6 percentage point increase.
When analyzing chart 2, it's important to keep in mind that it tacitly assigns the same CPI inflation to everyone's salary increase over the course of the period. Remember that even though the CPI is calculated using a representative sample of products and services, it is unlikely to accurately reflect an individual's cost of living. (The Atlanta Fed's myCPI tool will help you get a sense of how CPI inflation differs among sizable demographic groups.) Unfortunately, users cannot map myCPI inflation figures to the individual-level data used to construct the WGT.)
The worker groups with the highest (lowest) proportion of positive real wage growth also have the highest (lowest) median wage growth, which is not unexpected.
Remember that everyone's wage growth over a period is tacitly given the same CPI inflation rate when interpreting chart 2. Remember that the CPI measures changes in prices for a representative sample of goods and services, but that this sample is unlikely to accurately reflect each person's expense of living. You can get a sense of how CPI inflation differs across large demographic groups by using the myCPI tool from the Atlanta Fed. Sadly, users are unable to link myCPI inflation data to the individual-level data that was used to create the WGT.) percent of observations of wage growth above the rate of inflation
For instance, in 2022, versus 65 percent in 2019, only 60% of workers aged 16 to 24 experienced positive real wage increase. However, the decline in the percentage of workers aged 25 and older who had positive real wage growth, which was 5 percentage points, was much lower than the decline in the percentage of workers aged 16 to 24 who had positive real wage growth. The percentage of people 55 and older who experienced favorable real wage growth specifically decreased by 15 percentage points.
Because of the competitive labor market over the past few years, some workers have seen their nominal hourly wages rise proportionately more than others, which has masked the negative effects of greater inflation for those workers. The share of real wage losses has increased the most among older employees and those who have remained in their current jobs since the COVID-19 pandemic began in 2022. However, even within age and job mobility categories, nominal wage growth among people differs greatly. It is still difficult for economists to explain this variance; they frequently attribute it to things like variations in productivity growth at the individual and company level. It's possible that your experience with wage development differs from that of your neighbors or coworkers.
More By This Author:
What Consequences Follow From Consistent Wage Growth?
Wave-Trend Update
Central Banks Face A Conundrum


Comments
Log in or sign up to join the conversation.