

Image Source: DepositPhotos
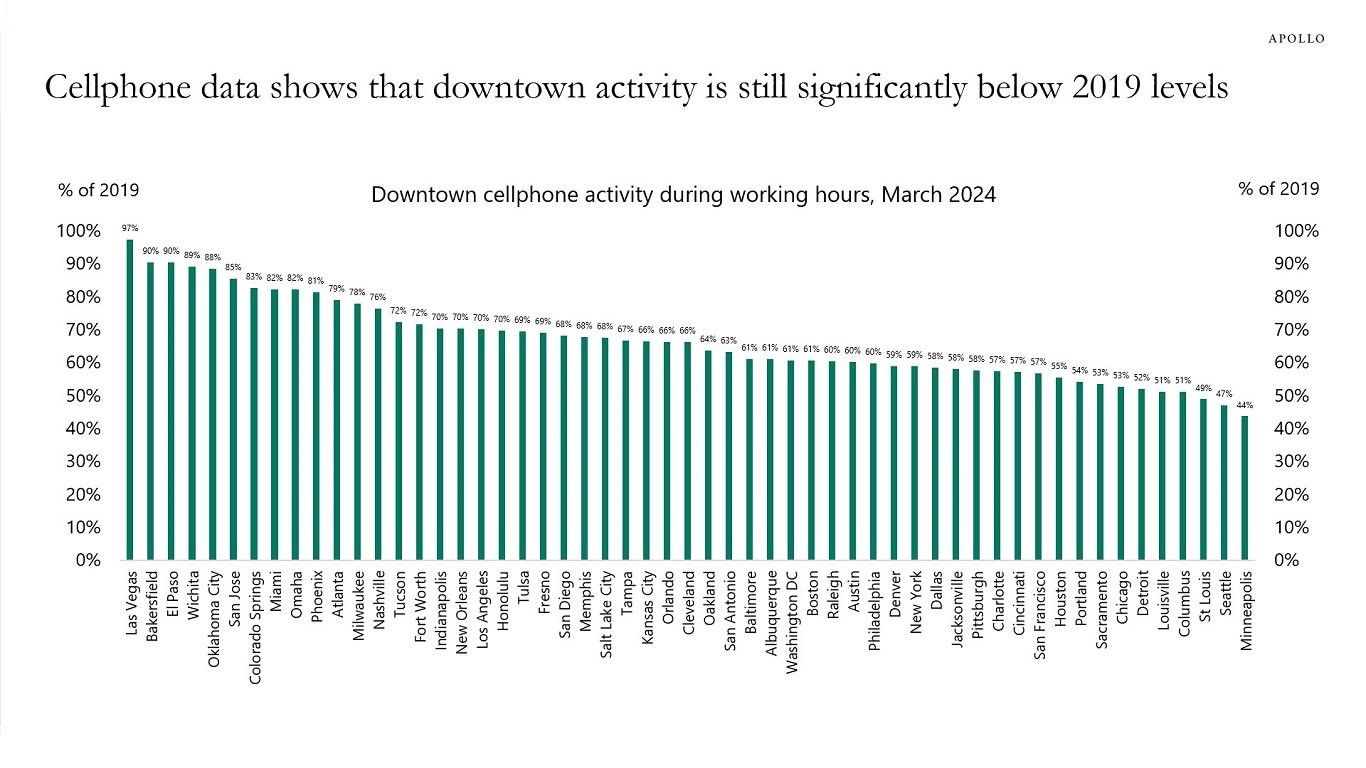
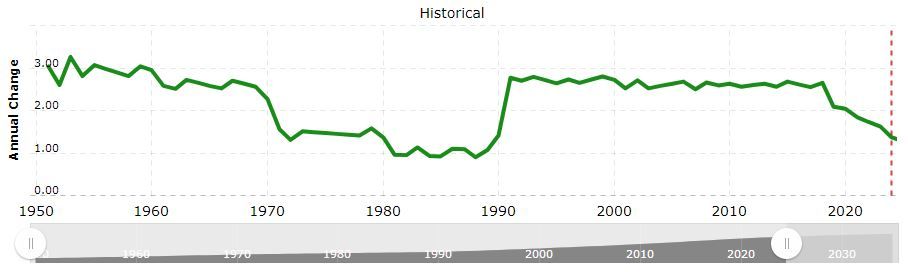
The chart below, courtesy of @KobeissiLetter on X, depicts downtown cell communication data for several major metropolitan areas as of March 2024. Cell phone activity during working hours is significantly below pre-pandemic levels in almost every major city across the country, including areas with significant population growth. The second chart below, from Macrotrends, shows Nashville’s population growth since 2019. While the high pre-pandemic growth rate has slowed, Nashville’s population still expanded by 1.4%, 1.6%, 1.7%, and 1.8% in the last four years, respectively. Yet, downtown Nashville’s cell communication data during working hours has declined by 24%.
Given that the labor market has remained tight in the days since the pandemic, the dip in communication data serves as a reminder that remote work is still going strong. Thus, the troubling devaluation in commercial real estate is likely not temporary. It’s only a matter of time until regional banks accept the losses as permanent, and hopefully, it will stop there. Jerome Powell has expressed confidence that any problems will be containable. However, GSIBs have exposure to regional banks, whether directly or indirectly.
What To Watch Today
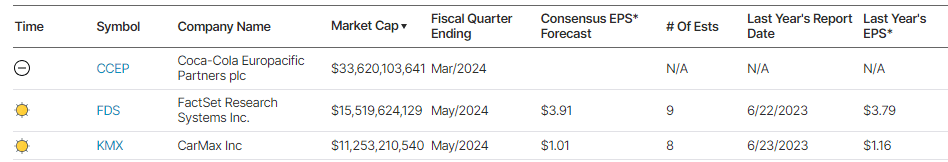
Earnings
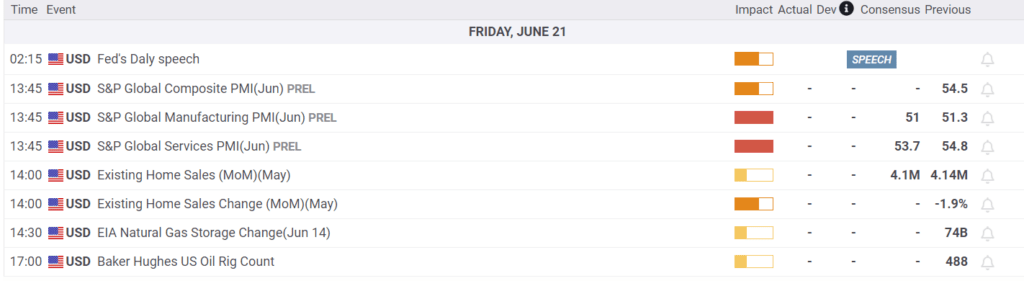
Economy
Market Trading Update
We discussed the current concern with the market’s overbought condition and weakening breadth yesterday. Not much changed, with the exception of the shear meltup in Nvidia shares. However, yesterday morning on the “Real Investment Show,” I had a question about energy stocks and their recent lag relative to oil prices.
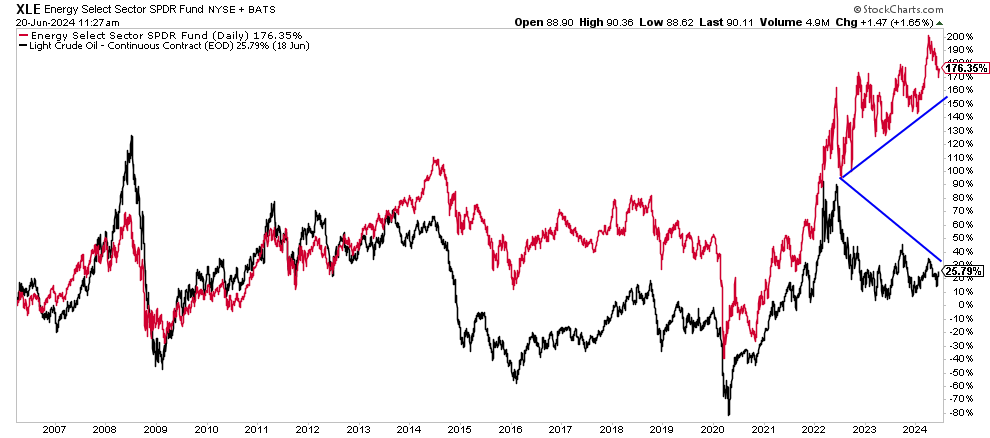
We agree. About a month ago, we noted that oil prices had become very oversold and were due for a bounce. Based on that analysis, we added to our portfolios’ current energy exposures. Subsequently, oil prices rose as expected, but energy company prices did not. Such got me to discuss that issue with our audience, where I produced the following chart of West Texas Intermediate Crude versus the SPDR Energy Sector ETF (XLE).
It should be unsurprising that oil prices and energy stocks generally have a high correlation. This is because oil prices drive energy companies’ revenue. However, since 2022, energy stocks have massively deviated from the underlying commodity. The chase for yield, market speculation, and other factors explain the current deviation. History suggests that the current deviation in performance is unsustainable, and the energy sector could see rather substantial declines during the next period of oil price weakness. Such a downturn in oil prices would result from a demand drop during a recessionary cycle.
Given that historically, energy stocks catch “down” to oil prices during such events, the next correction in energy stock prices could be rather substantial.
Could Nuclear Energy End Up Powering the Future?
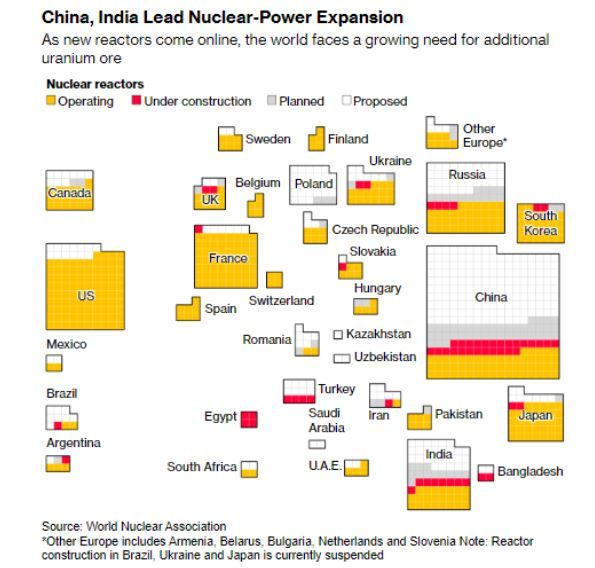
There’s likely a bright future in Uranium, as nuclear energy could power the digital economy. Growth in electricity demand is projected to outpace capacity in coming years due to increased consumption by data centers and electrification in general. Although the reactors can take many years to come online, nuclear energy certainly aligns with energy transition goals as a carbon-free energy source. Bill Gates’ nuclear power startup, TerraEnergy, broke ground on its first commercial reactor earlier this month. Gates expects the project to be complete by 2030. A downside to the energy source is that perceived risks, long lead times to completion, and high costs may make these projects less compelling investment opportunities. While nuclear energy projects are expanding globally, unfortunately, the US is lagging in terms of capacity in the works. As shown in the chart below from @chigrl, China and India currently lead the world in reactors under construction.
Home Builder Sentiment is Struggling
The home construction industry is showing signs of slowing down lately. May housing starts posted the fifth decline in the past six months (-5.5% MoM). Meanwhile single-family permits fell for the fourth consecutive month (-3.8% MoM). The picture looks grim as both housing starts and permits fell to their lowest since the pandemic. The slowing home builder data aligns with other evidence we’ve seen that indicates the economy is beginning to slow. What’s contradictive, however, is that residential construction employment has been charging on to record highs. Given housing starts as a leading indicator, we believe the residential construction employment market will begin showing signs of loosening sooner rather than later.

Tweet of the Day
More By This Author:
Global Diversification Might Not Be DeadMega Cap Valuations Are Dwarfed By Tesla
Consumer Survey Shows Rising Bullishness


Comments
Log in or sign up to join the conversation.