
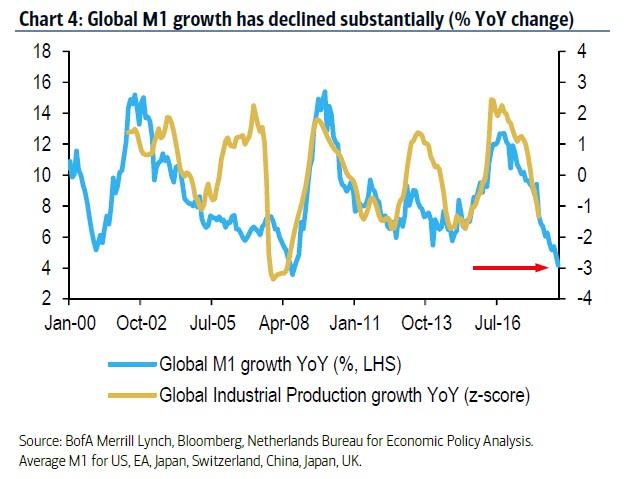
According To This Leading Indicator, The World Is Now In A Recession
Earlier this week, we presented an ominous for the world economy chart: namely the collapse of the global money supply which has been declining rapidly over the last year and a half. In fact, global money supply growth (using M1) is now flirting with the lows seen in mid-2008. And while some economies, such as China, are now desperately trying to pivot back to supportive measures, BofA's Barnaby Martin recently warned that high global debt will constrain enthusiasm for engaging in further rounds of stimulus. Meanwhile, as the chart below suggests, lower money supply growth has always pointed to weaker global economic momentum going forward. In fact, if one uses Global Industrial Production growth as a proxy for the global economic expansion, or contraction, the World is now almost certainly in a recession; the only question is when will economists acknowledge it.
(Click on image to enlarge)
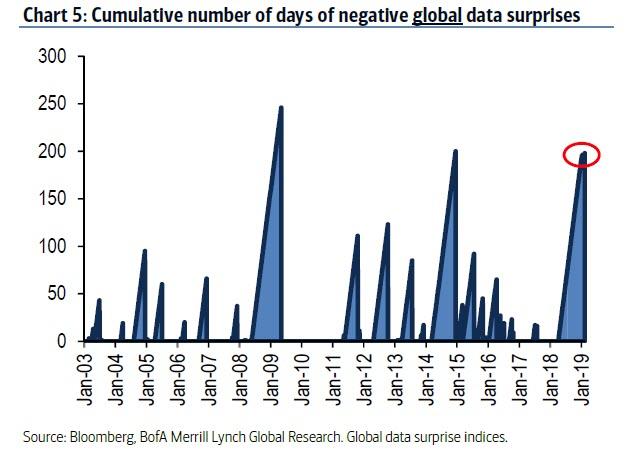
The message from the chart above has also been heard loud and clear in high-frequency economic indicators (at least in those countries where the government is not shut down and where data is still being reported), with the number of consecutive days of negative global data surprises now approaching the longest since the financial crisis.
(Click on image to enlarge)
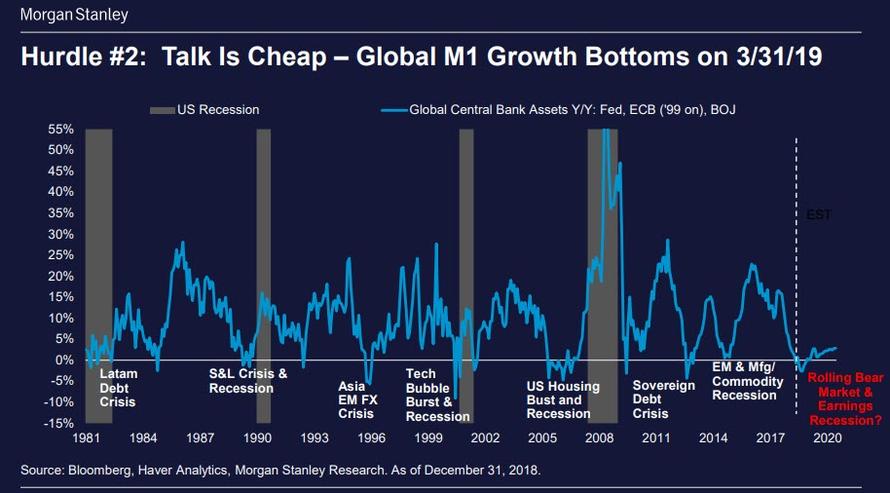
And just to confirm that the collapse in Global M1 growth is a major problem - perhaps the biggest for the global economy - Morgan Stanley showed the following chart which confirms that every time M1 has dipped negative - as central bank liquidity injection either slowed or went into reverse - there has been a financial crisis: whether the 2015 EM and Manufacturing Commodity Recession, the Sovereign Debt Crisis of 2011, the Global Financial Crisis and US Housing bubble burst of 2007/2008, the Tech Bubble burst of 2000 and so on.
(Click on image to enlarge)
So yes, there is little doubt that global growth is slowing the only question is how forcefully. Today, courtesy of BMO, we present another chart which shows that the world economy is as of this moment almost certainly in a recession.
As economist Douglas Porter observes, the OECD’s leading indicator is a good guidepost of what is coming just around the corner, although it doesn’t lead broad GDP trends by much (perhaps a month or so). It was just released Monday, and dipped for the 11th month in a row—it peaked in December 2017—clearly signaling a cooldown.
(Click on image to enlarge)
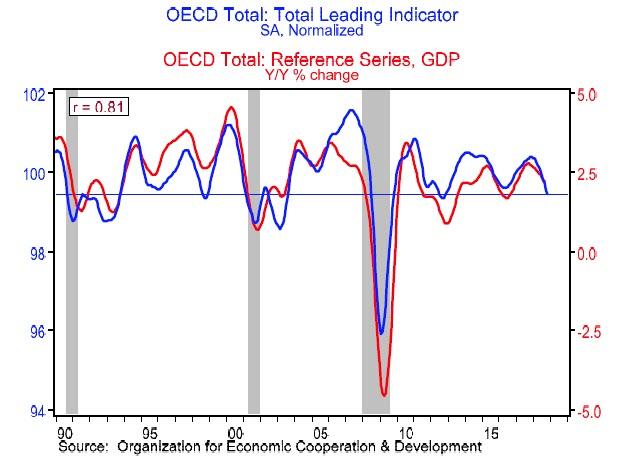
What the chart clearly shows is that the last three cycles all ended when the leading indicator dropped to where it is now (even though there have also been two false signals in that timeframe—during the Asian crisis in 1998, and during the Euro crisis in 2012).
So the question what happens next will have to be answered by policymakers who have no choice but to try and push higher the blue line in the chart above. In other words, the fate of this cycle will be determined by how policymakers now respond, and how markets and consumer/business sentiment hold up in coming weeks.
And since it is all up to central banks once again to boost liquidity, something they won't be doing during the current QT phase unless something drastically changes over the next 12 months...
(Click on image to enlarge)
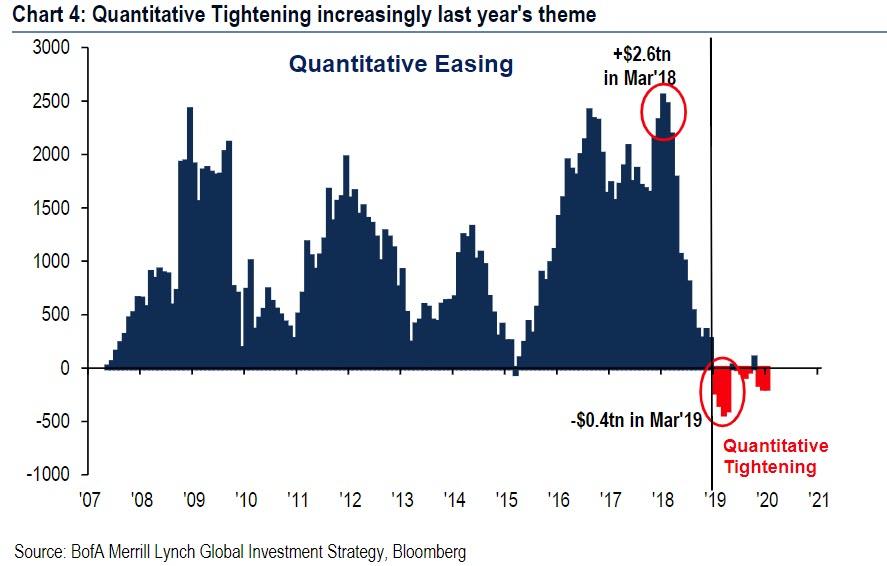
... the above charts confirm that the key variable for the global economy is not whether the Fed stops hiking or starts cutting rates (although any further rate hikes will surely have an adverse impact on global liquidity), but whether the Fed - and other central banks - pause their balance sheet shrinkage, and once again start actively injecting liquidity into the global system, or soon enough we will be looking for the best description of "[insert here] crisis of 2019."
Disclosure: Copyright ©2009-2018 ZeroHedge.com/ABC Media, LTD; All Rights Reserved. Zero Hedge is intended for Mature Audiences. Familiarize yourself with our legal and use policies every time ...
more


I agree it is hard to reverse QE. I think every economist knew this long before and some just chose to lie about it. It is good the Fed is trying to reverse it a little. I do not think they can or will reverse it as much as some expect. Sadly it will take a long time and more than likely a recession will hit before they reverse a substantial amount of it.
If allowed, the Fed should slow interest rate hikes and continue to reverse QE as long as it can in a reasonable manner. This is not really under the Fed's control. The Fed has raised rates as a delayed response to higher rates in the market. They were not the initiator of higher rates as they usually are. Now that long term rates have subsided, hopefully the markets will hold and rate rises can be slowed considerably.
The author is right that tightening the Fed's balance sheet is risky. This is reversing QE which is hard to do. This is why it should not be done save maybe only in a recession. Certainly not the way it was done this cycle.