
Economic Surprise Index Turns Positive
When it comes to economic reports, one trend that has seemingly been in place all year is that the vast majority of data points have come in short of expectations. The fact that economic momentum has been slowing is one thing, but when the economy consistently comes up short relative to expectations, it sets a tone that things are quickly deteriorating. That’s never a good thing, but thankfully, there are signs that the tide is turning.
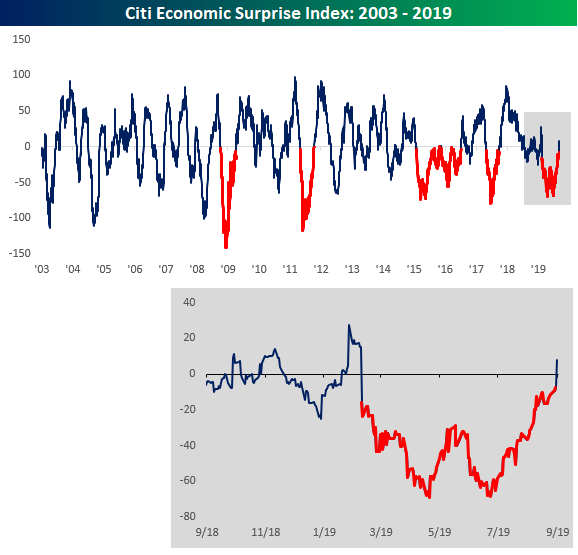
The Citi Economic Surprise Index measures the pace at which economic indicators are coming in ahead of or below consensus forecasts. When the index is negative, it means that the majority of reports are coming in below expectations, while a positive reading indicates that most data is coming in ahead of expectations. The chart below shows the index going back to 2003, and the parts where the line is red indicate periods where the index was negative for at least 100 trading days. The most recent period of negative readings was one of the longest ever at 140 trading days and just the 6th streak of 100 or more trading days (during the period from 2015 to 2016 there were actually two separate streaks although it looks like just one long streak in the chart). The fact that this index is now positive indicates that economists have finally ratcheted down estimates enough to be in line with actual conditions on the ground.
(Click on image to enlarge)
Start a two-week free trial to Bespoke Institutional to access our interactive economic indicators monitor and much ...
more

