
Dow Fulfills Technical Definition Of New Bull Market, Not S&P 500, Which Is What Matters
There is already a debate going on as to if a new bull market has begun. What is more important at this stage is if last week’s low holds, as stocks likely come under pressure near term. Regardless if a bottom is in, stocks likely are at the beginning stages of one.
It has only been five weeks since the longest bull market in U.S. stocks ended February 19th. The massive three-day rally last week has raised some confusion as to if a new one is already underway. The technical definition of a bull market is a 20-percent rise from a previous low.
On this basis, the Dow Industrials (DIA) closed on 18591.93 last Monday, rising to 22552.17 by Thursday. The 21.3-percent rally from the low fulfills the technical definition of a bull market. This, of course, assumes the March 23rd low does not get breached in the days and weeks ahead.
Other indices, however, are not there yet. From low to high on a closing basis, the Nasdaq Composite (COMP) only rallied 13.7 percent, the Russell 2000 (IWM) small cap index, which bottomed on the 18th, 19.1 percent, and the S&P 500 large cap index 17.6 percent.
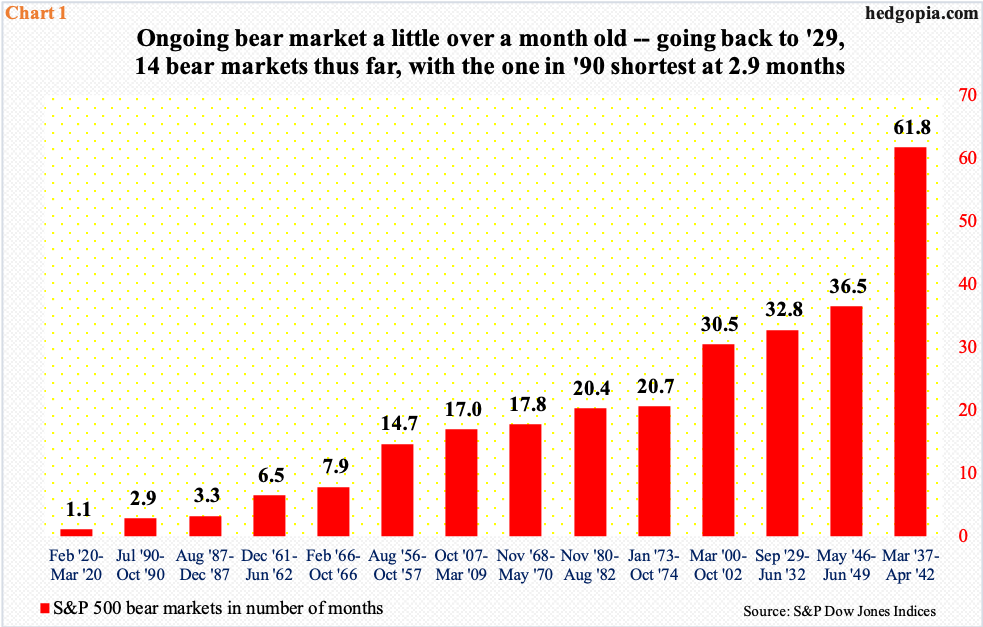
Being an index made up of the largest U.S. companies, the S&P 500 (SPY) has the clout and is used by the investing community as the arbiter in this regard. For this reason, it is a still a bear. Chart 1 plots 14 bear markets going back to 1929, with the longest lasting more than five years in 1937-1942 and the shortest less than three months in 1990. Should last week’s closing low of 2237.40 not get breached, this bear will be the shortest at just over a month. Time will tell.
Technical definition aside, it just does not feel like a bull market. The news flow regarding the coronavirus continues to be bad, with continued hit to the global economy. There is this, though. Markets tend to move way ahead of actual improvement in the data.
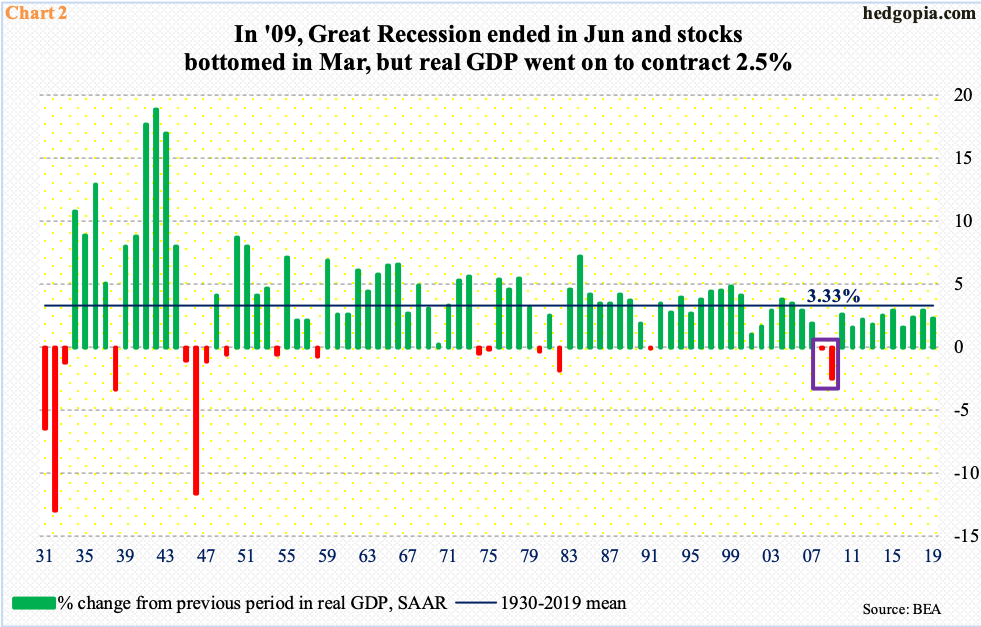
In 2008, real GDP in the U.S. fell 0.1 percent. This was preceded by growth of 1.9 percent in 2007. The S&P 500 peaked in October 2007, then tumbled 38.5 percent in 2008. It finally bottomed in March 2009, rallying 23.5 percent that year. Real GDP, however, contracted 2.5 percent in 2009 (box in Chart 2), with Great Recession ending in June that year.
The point is, stocks did not wait for news to get better. They led.
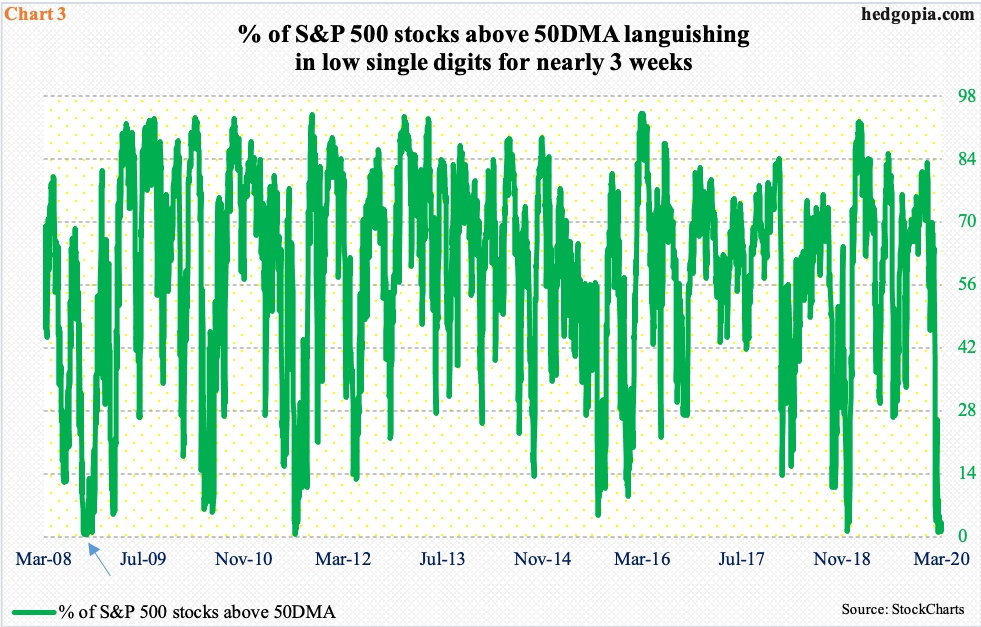
It is too soon to declare this is what is happening right now or conclude one way or the other, for that matter. Bulls do have this, though. Several indicators are languishing at/near washout levels. This includes investor sentiment – both survey- and money-based (more on this here) and Chart 3.
Despite last week’s 10.3-percent jump in the S&P 500, only 1.8 percent of the constituent stocks are above their 50-day moving average. In fact, on the 12th, this dropped to one percent, which was the lowest since August 2011 when it dipped to 0.4 percent but did not persist in low single digits for too long. It did in 2008 when this metric languished in low single digits for a month and a half (arrow in the chart), versus a little under three weeks this time around.
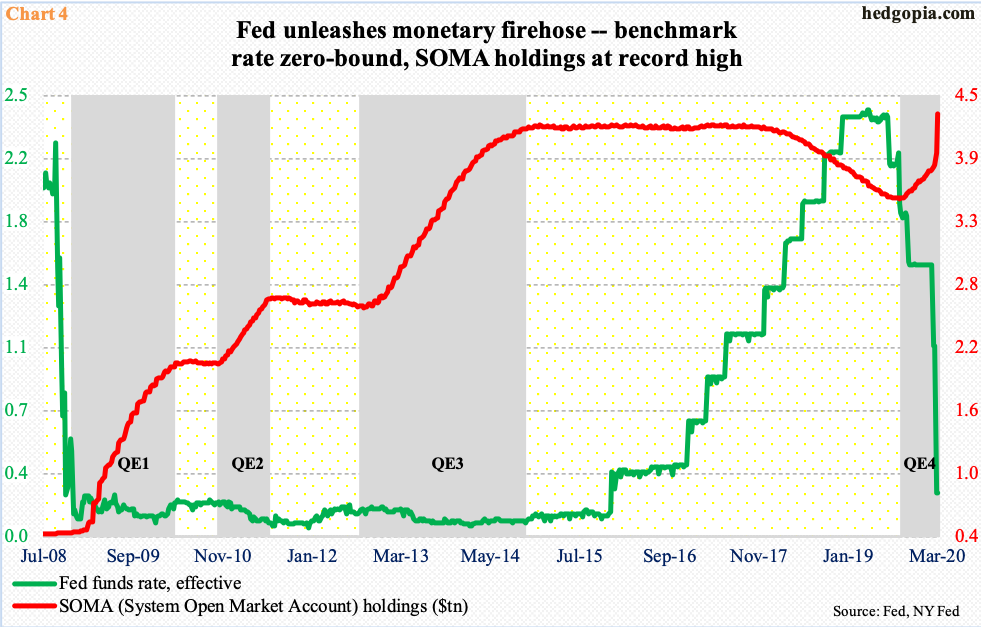
Globally, major economies have aggressively responded to the virus-spurred disruptions using both fiscal and monetary tools. In the U.S. a $2-trillion relief package has just been signed into law, and the Fed has come out with a big bazooka.
It now has an open-ended QE program in place. The balance sheet has no limits. Following on the footsteps of the European Central Bank and the Bank of Japan, it is also moving into corporate bonds, with plans to buy investment-grade securities in both primary and secondary markets and through ETFs. Last Monday’s announcement to this effect followed two other emergency announcements. On March 3, the fed funds rate was cut by 50 basis points. Then on the 15th, the policy rate was cut by another 100 basis points to a range of zero to 25 basis points.
By last Wednesday, SOMA (System Open Market Account) holdings stood at $4.34 trillion – a new record, up $352.8 billion for the week and $464.6 billion for the last couple of weeks (Chart 4). From late September, these holdings have gone up by $783.1 billion.
The Fed is using a firehose to flood the system with monetary stimulus. The hope is this will unleash animal spirits, so investors get tempted, even compelled, to take on risk and move up the risk curve. Once stocks stabilize and begin to rally, wealth effect will kick in. That is the hope. This worked to perfection during the 2007-2009 financial crisis. Thus far, stocks’ reaction function has been tentative, but it is too soon to declare one way or the other.
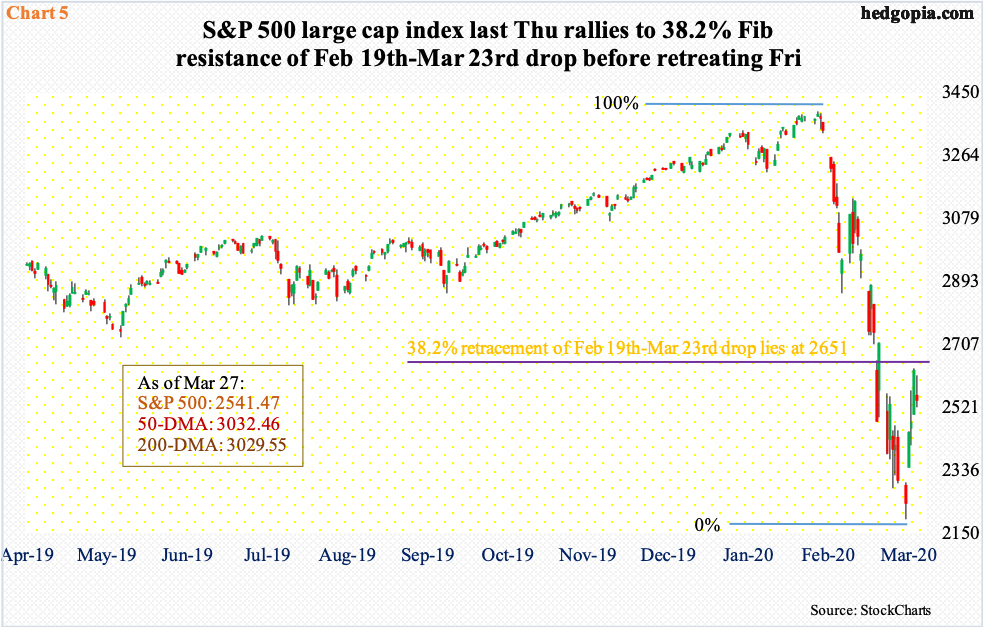
Last week, Monday’s announcement of unlimited QE elicited more selling in stocks, with the S&P 500 tumbling 4.9 percent intraday to close out the session down 2.9 percent. From its February 19th high to last week’s intraday low of 2191.86, the index crashed 35.4 percent in merely 24 trading sessions. After a drop like this, relief is always possible. From low to high last week, the index shot up 20.3 percent intraday, before coming under pressure Friday.
Where sellers appeared Friday may have significance. A 38.2-percent retracement of the February 19th-March 23rd decline rests at 2650.89. Thursday’s high was 2637.01. These are Fibonacci levels, which have a wide following.
Concurrently, several indicators on the daily such as the RSI have reached the median. They just rallied from oversold levels, and it will be difficult for them to rally right past the median and into overbought zone. The path of least resistance is down and how they behave in the sessions ahead will be telling.
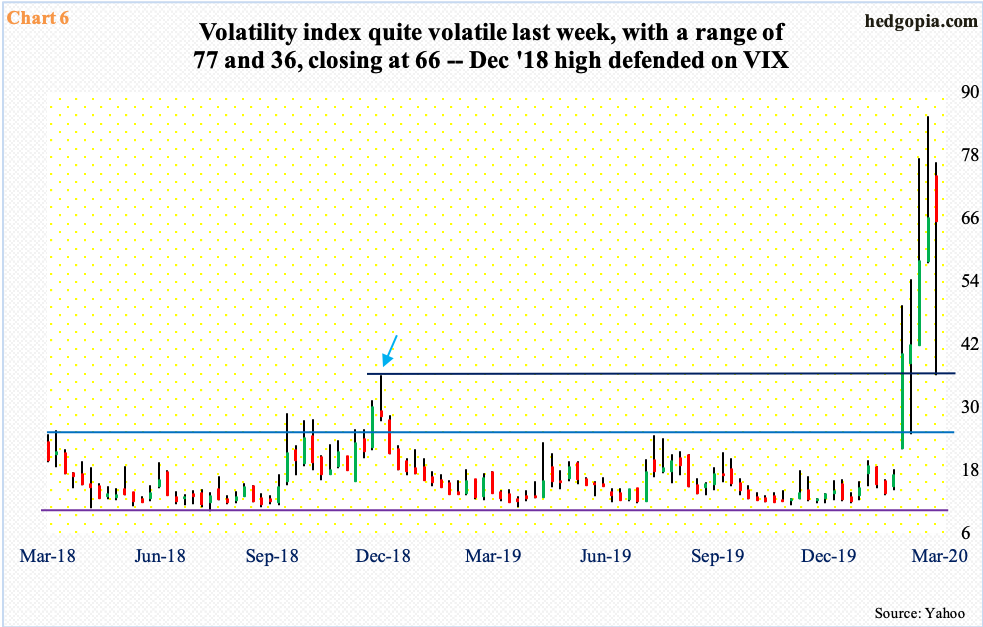
VIX, too, is at an interesting spot. On March 18, it printed 85.47, which was the highest since October 2008 when the volatility index surged to an all-time high of 89.53. Then last Tuesday, it dropped to 36.24 intraday, before closing out the week at 65.54.
Last week’s low was a test of the December 2018 high when VIX peaked at 36.20 (arrow in Chart 6). Defense of that high is perhaps an indication that we could be in for sustained volatility for some time to come. At least on the daily, VIX acts like it is itching to move up near term. It held up strongly last week – only down 0.8 percent against a double-digit rally in the S&P 500.
How this week, or the next several sessions, behave will be crucial. The bull-bear debate aside and regardless of whether or not last week’s low marks the bottom in this bear market, stocks likely are at the beginning stages of a bottom.


