


The three major equity indices are all down from their recent all-time highs and closed last week right on – or in slight breach of – potentially important support. A decisive breakdown will meaningfully swing the odds to bears’ favor.
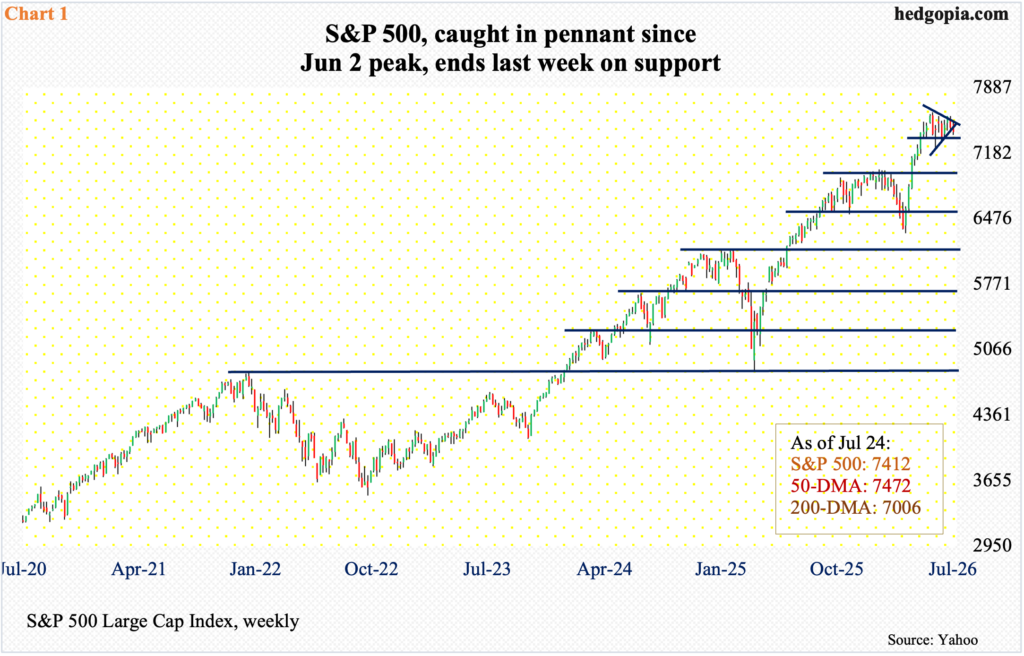
The S&P 500 closed last week clinging on to a pennant from June 2 when it peaked at 7621. In fact, the large cap index is in slight breach of the support, although not in a major way (Chart 1). This week will be key.
Last week’s 0.6-percent decline represents a back-to-back weekly drop for the index, as bears prevailed in four of the five sessions, closing at 7412. Bulls were unable to save the 50-day (7472), with the average acting as a magnet for the past month and a half. In a strong market, the 50-day should act as a trampoline, as either existing longs add to positions or new ones enter.
Concurrently, the daily Bollinger bands have continued to tighten. This often happens when the price is about to make a major move. The S&P 500 bottomed at 6317 on March 30; bulls thus are sitting on tons of paper profit. A decisive pennant breakdown likely results in a quick test of horizontal support at 7330s.
In due course, a crucial breakout retest occurs at 7000, or just underneath, with the 200-day at 7006 right there.
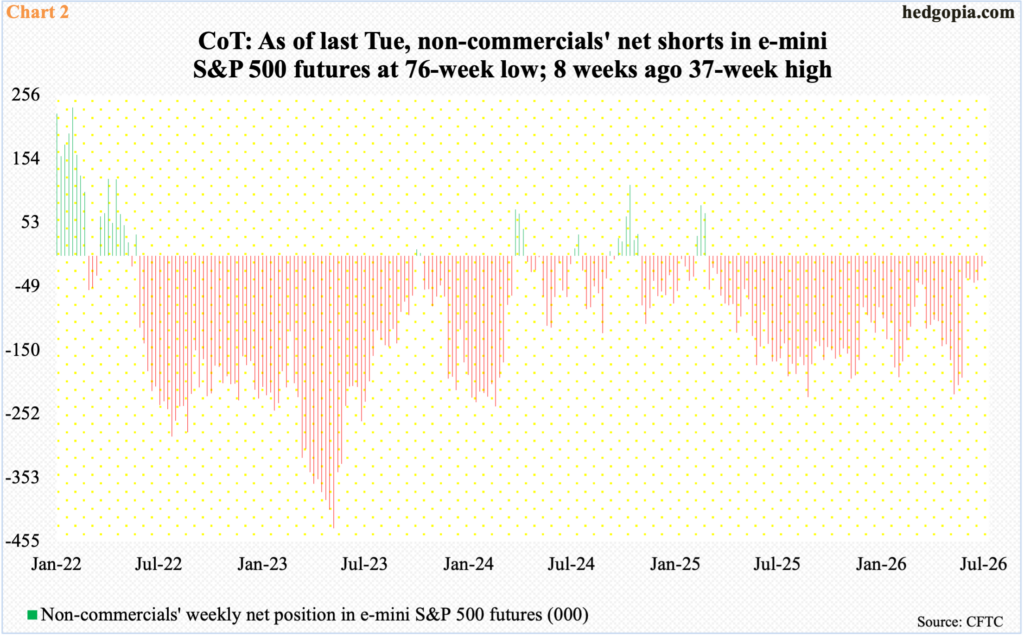
The cash is acting this way even as non-commercial futures traders are this close to jumping on the bullish bandwagon. Bulls probably would not like the speed at which these traders have reduced their net shorts in e-mini S&P 500 futures.
In the week to June 2, non-commercials were net short 220,768 contracts – a 37-week high – before gradually cutting those down to last week’s 16,784 (Chart 2). The current holdings are the lowest since February last year. For a contrarian, this is a yellow signal, if not outright red.
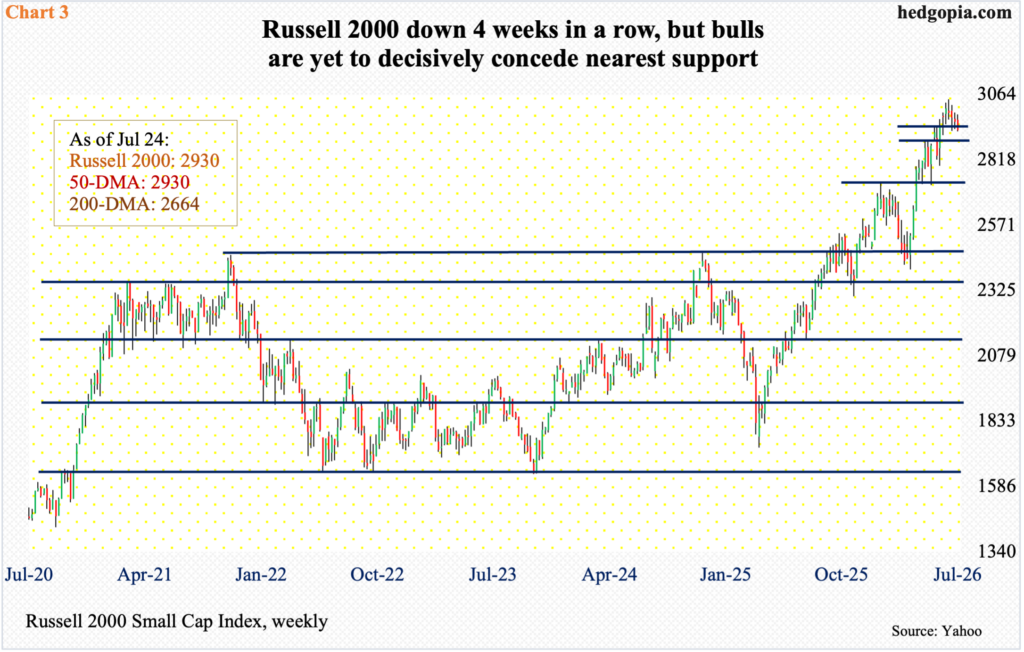
Small-cap bulls similarly are barely clinging on to important support. Unlike its large-cap cousins which peaked early last month, the Russell 2000 did so early this month when it tagged 3047 on the 1st. Since then, the small cap index has declined four weeks in a row, although it is yet to decisively compromise 2940s (Chart 3).
Last week, the Russell 2000 gave back 1.1 percent to 2930, having tagged 2924 intraday Thursday. This is the third week in a row the bulls have defended 2940s. Once this gives way, the next level to watch is not until 2880s, followed by 2720s. Bears will likely get active once the 50-day (2930) is breached.
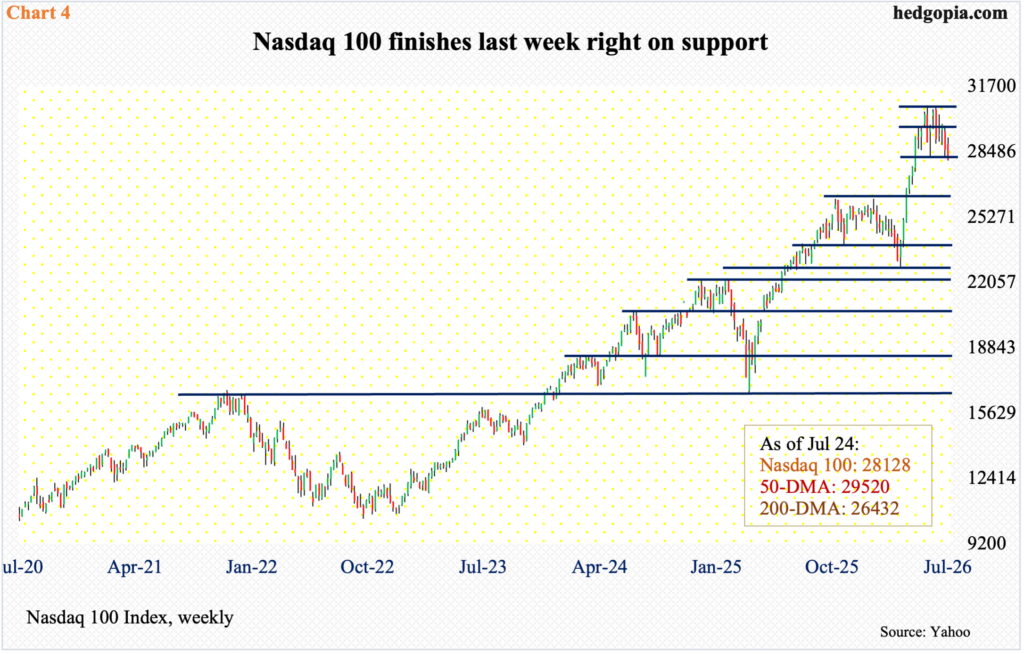
Also sitting on support is the Nasdaq 100, which dropped 1.6 percent last week to 28128, with a weekly low of 28053 ticked on Friday. Near-term horizontal support at 28200s has been slightly breached, but nothing decisive just yet.
This week is key. If June-quarter results last week from Google parent Alphabet (GOOG), Tesla (TSLA) and Intel (INTC) are a sign of things to come, bulls are probably feeling nervous. All these companies delivered strong results, yet markets treated them as an opportunity to bail out. This week, Microsoft (MSFT) and Facebook parent Meta Platforms (META) are due out Wednesday and Apple (AAPL) and Amazon (AMZN) will publish theirs on Thursday.
Leading into this, the tech-heavy index trades tentative, having peaked at 30762 on June 3. Through that high, it jumped 34.7 percent from the March 30 low of 22841. A convincing breach of 28200s should open the door to an eventual breakout retest of 26200s (Chart 4).

Comments
Log in or sign up to join the conversation.