
Don’t Fret About Higher Claims
Fingers were crossed that this week’s initial jobless claims would help to bring some clarity after the past month has seen a couple of low readings and a couple of elevated readings. Unfortunately, that did not happen as claims spiked to their highest level since September of 2017 at 252K. That was a 49K rise from last week and a 38K miss relative to forecasts. That is both the largest WoW increase and the widest miss since September 2017.
(Click on image to enlarge)

Additionally, this massive surge in claims has brought an end to the record streak in which claims have come in at or below 250K. Granted, the streak at or below 300K is still going strong at 249 weeks. That’s nearly five years!
(Click on image to enlarge)

While there was some help from an elevated reading of 227K rolling off of the four-week moving average this week, the 252K that replaced it has sent the average 6.25K higher to 224K. That is the largest one week increase since the first week of May when it rose by 7.75K. Similarly, the last time the four-week moving average was as high or higher than the current reading was on May 10th when it rose to 225K.
(Click on image to enlarge)

While at first glance this massive increase in the context of relatively flat claims over the past year may seem like a concern, more than likely it all comes down to pure seasonality especially as Thanksgiving arrived later this year. As shown in the chart below, the current week of the year has historically been the most volatile for seasonally adjusted initial jobless claims. The standard deviation for the weekly changes is at 26.98, nearly double the average standard deviation (13.96) for all weeks of the year.
(Click on image to enlarge)

Turning to the non-seasonally adjusted data claims also rose dramatically totaling 317.5K compared to 216.8K last week. That is the first time NSA claims rose by over 100K in a single week since December 2017. Again, while at first glance, the fact that it was a 56K YoY increase and the highest number for the current week of the year since 2016 may be concerning, it most likely can be chalked up to seasonality around the holidays and a later Thanksgiving.
(Click on image to enlarge)

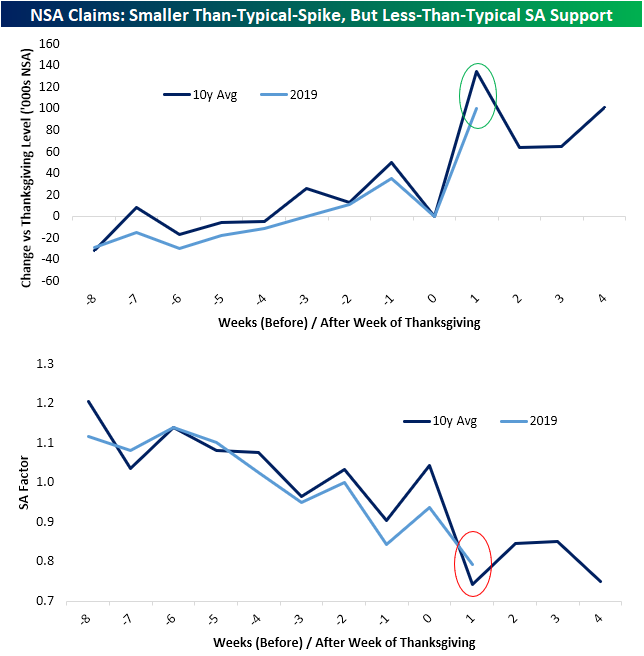
To emphasize this, we normalized the data around the Thanksgiving holiday. As shown in the charts below, for the NSA data, this year has actually seen a smaller than average spike in the weeks following the holiday when compared to the past decade’s average. And when it comes to the SA number, the seasonal factor used in adjusting the NSA data was larger than average this week.
(Click on image to enlarge)
Start a two-week free trial to Bespoke Institutional to access our interactive economic indicators monitor and much ...
more

