
Deceleration
Over the last week, we’ve had new readings on employment, income, sales, and monthly GDP:
(Click on image to enlarge)

Figure 1: Nonfarm payroll employment (blue), industrial production (red), personal income excluding transfers in Ch.2012$ (green), manufacturing and trade sales in Ch.2012$ (black), and monthly GDP in Ch.2012$ (pink bold), all log normalized to 2019M01=0.Source: BLS, Federal Reserve, BEA, via FRED, Macroeconomic Advisers (10/28 release), and author’s calculations.
While there is no clear downturn (save in industrial output), deceleration is apparent. This is most obvious in the smoothest series, nonfarm payroll employment.
(Click on image to enlarge)
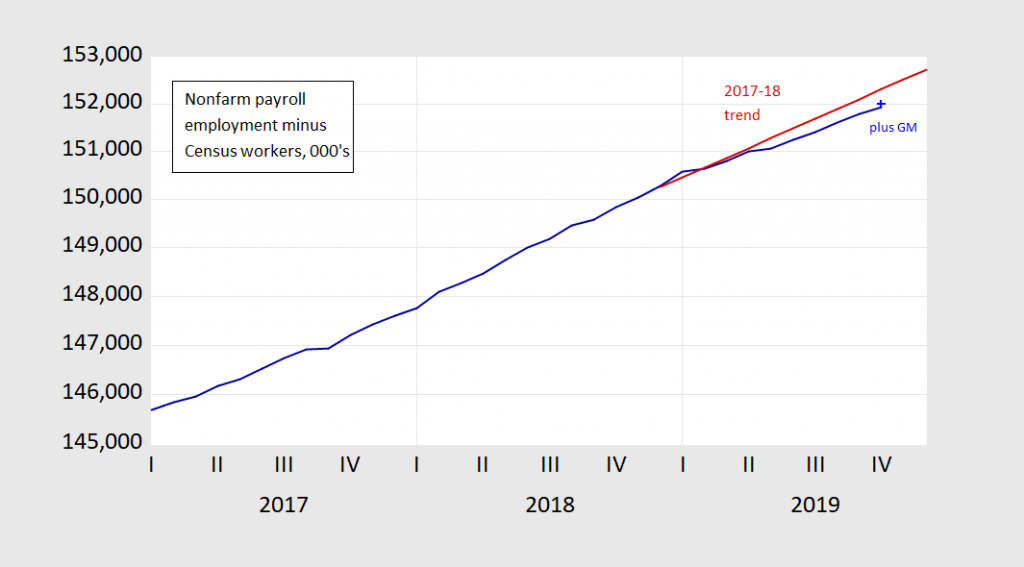
Figure 2: Nonfarm payroll employment excluding temporary Census workers (blue), October value-adding in striking GM workers at 50,000 (blue +), and 2017-18 stochastic trend (red). Source: BLS, and author’s calculations.
This deceleration has shown up in the Chicago Fed National Activity Index (CFNAI).
(Click on image to enlarge)
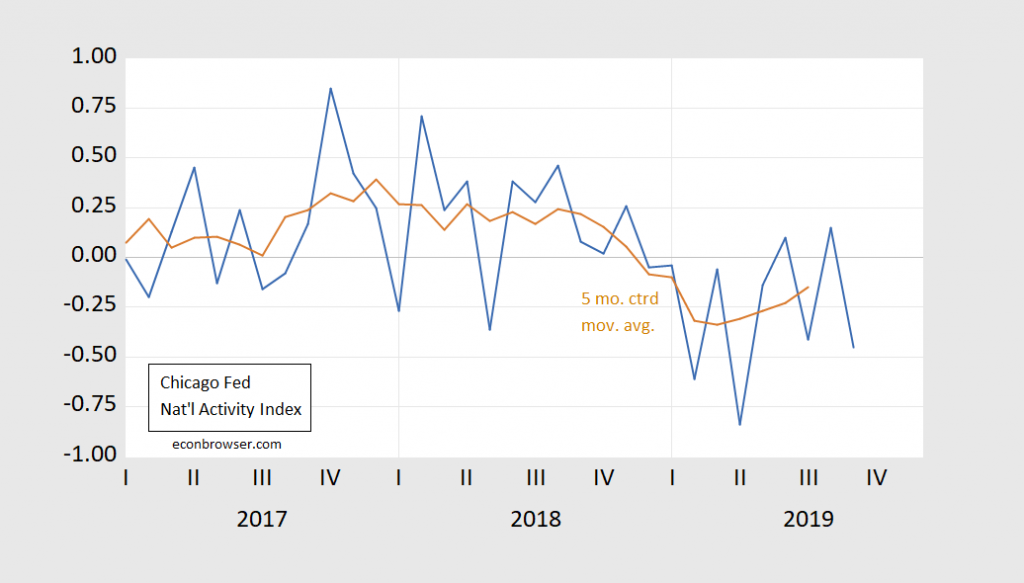
Source: Chicago Fed.
The 3-month moving average is at -0.24, which is not at the threshold of -0.70 that is identified with recession.
Disclosure: None.


