

Image Source: Pexels
Dash has been moving nicely as anticipated, and we want to represent as an educational article how we spotted the bottom and bullish reversal in the past months.
If we go back to June 26, we warned our member of a potential bottom formation, because we noticed the final stages of the wedge pattern within wave 5 of an impulse into wave V.
(Click on image to enlarge)
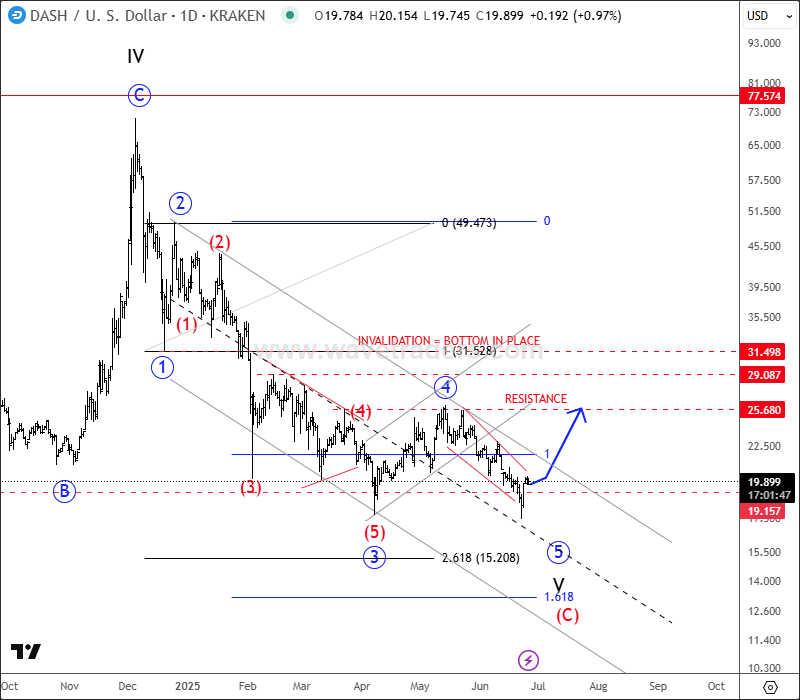
DSHUSD Daily Chart From June 26
Later on August 11, we also shared a free chart with the public, where we mentioned and highlighted that it’s bottoming and forming a bullish setup, as we saw a nice recovery back above channel resistance line.
(Click on image to enlarge)
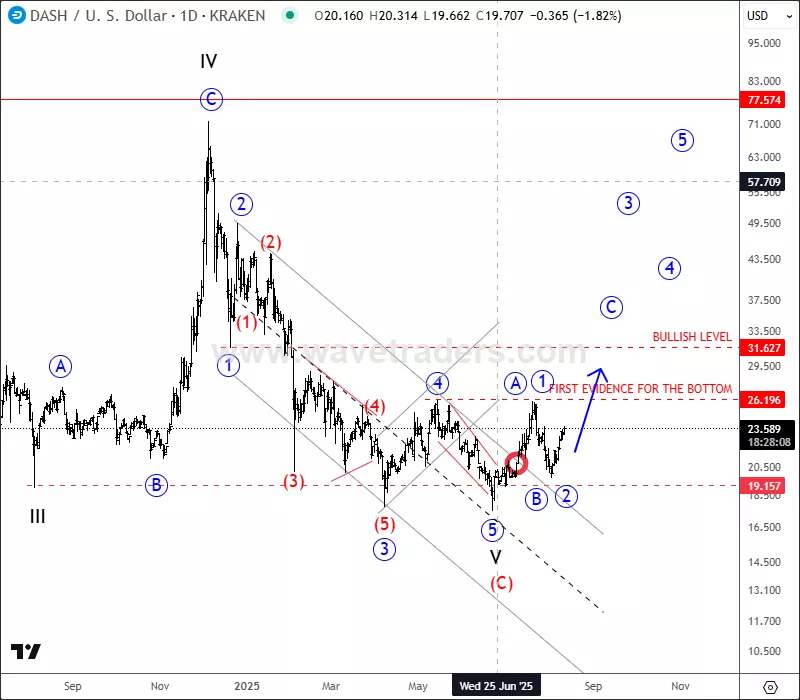
DSHUSD Daily Chart From August 11
It took some time, and on September 22, we were still looking for a bullish reversal, as it was still accumulating and forming a bullish setup with waves A/1 and B/2 that can shoot the price higher into wave C or 3.
(Click on image to enlarge)
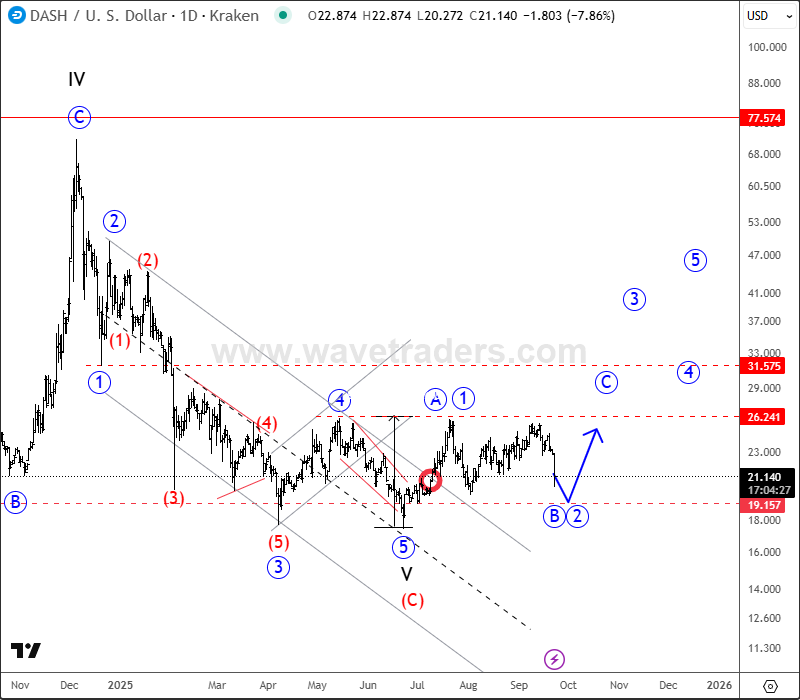
DSHUSD Daily Chart From September 22
And then finally, at the beginning of October, Dash exploded to the upside, so on October 10, we shared the chart with our members, where we pointed out that it’s in wave 3 of an ongoing five-wave bullish impulse that can send the price much higher.
(Click on image to enlarge)
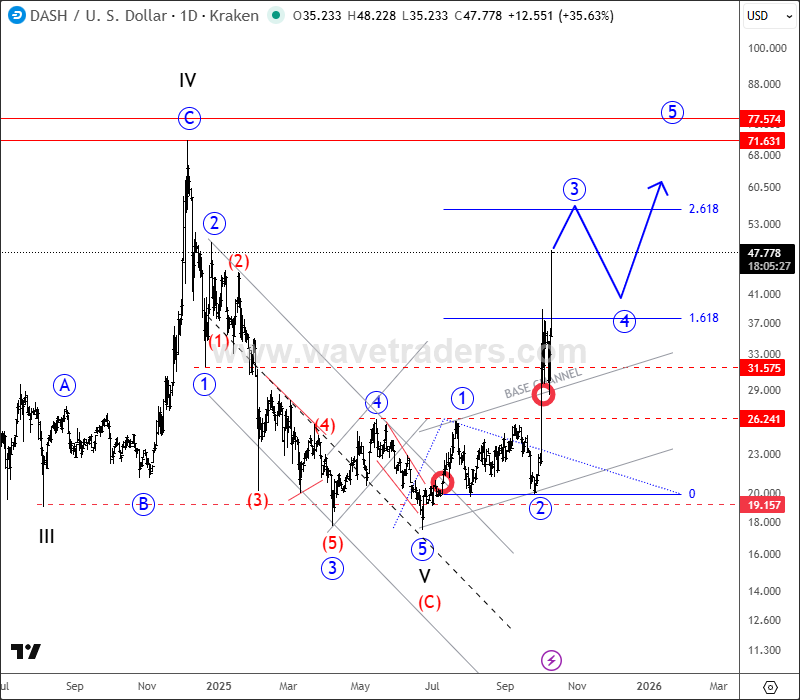
DSHUSD Daily Chart From October 10
As you can see today, Dash is already at 100 area, making around 655% since we spotted the bottom and bullish reversal.
(Click on image to enlarge)
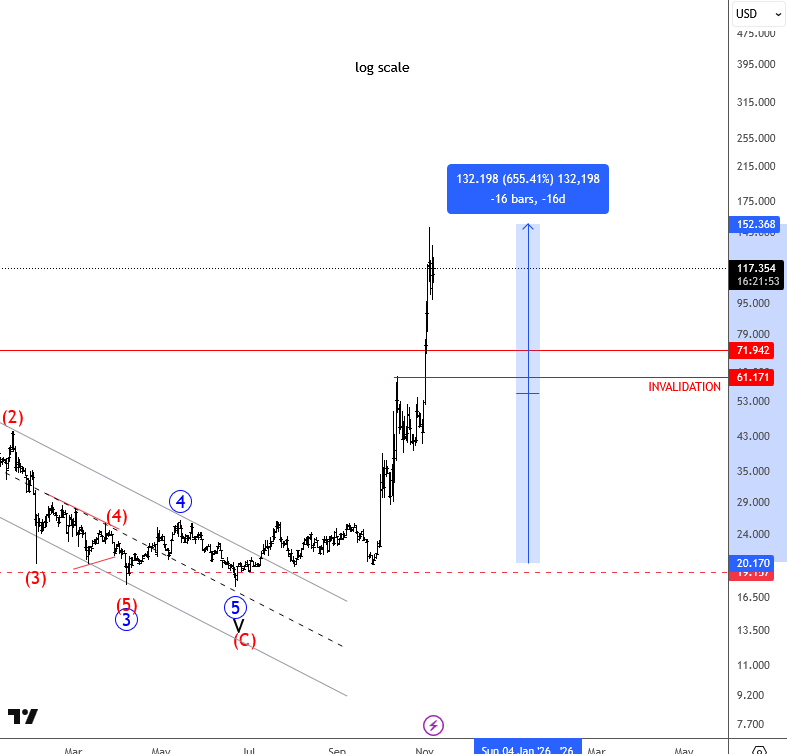
DSHUSD Daily Chart From November 07
More By This Author:
MicroStrategy Approches The Support As Correction Nears Completion
Microsoft Is Trading In Wave 4 Correction
Gold Can Stay In Consolidation As USDCNH Recovers And Fed "Signals" A Pause


Comments
Log in or sign up to join the conversation.