

- USD/JPY has broken out of a Broadening Formation pattern and is falling towards its target.
- The pair has probably reversed its short-term trend and risks now lie to the downside, in line with the bearish bias.
USD/JPY has breached the bottom of a bearish Broadening Formation price pattern and is falling toward the first downside target at 148.54, the 61.8% Fibonacci extrapolation of the height of the pattern extrapolated down.
USD/JPY Daily Chart
(Click on image to enlarge)
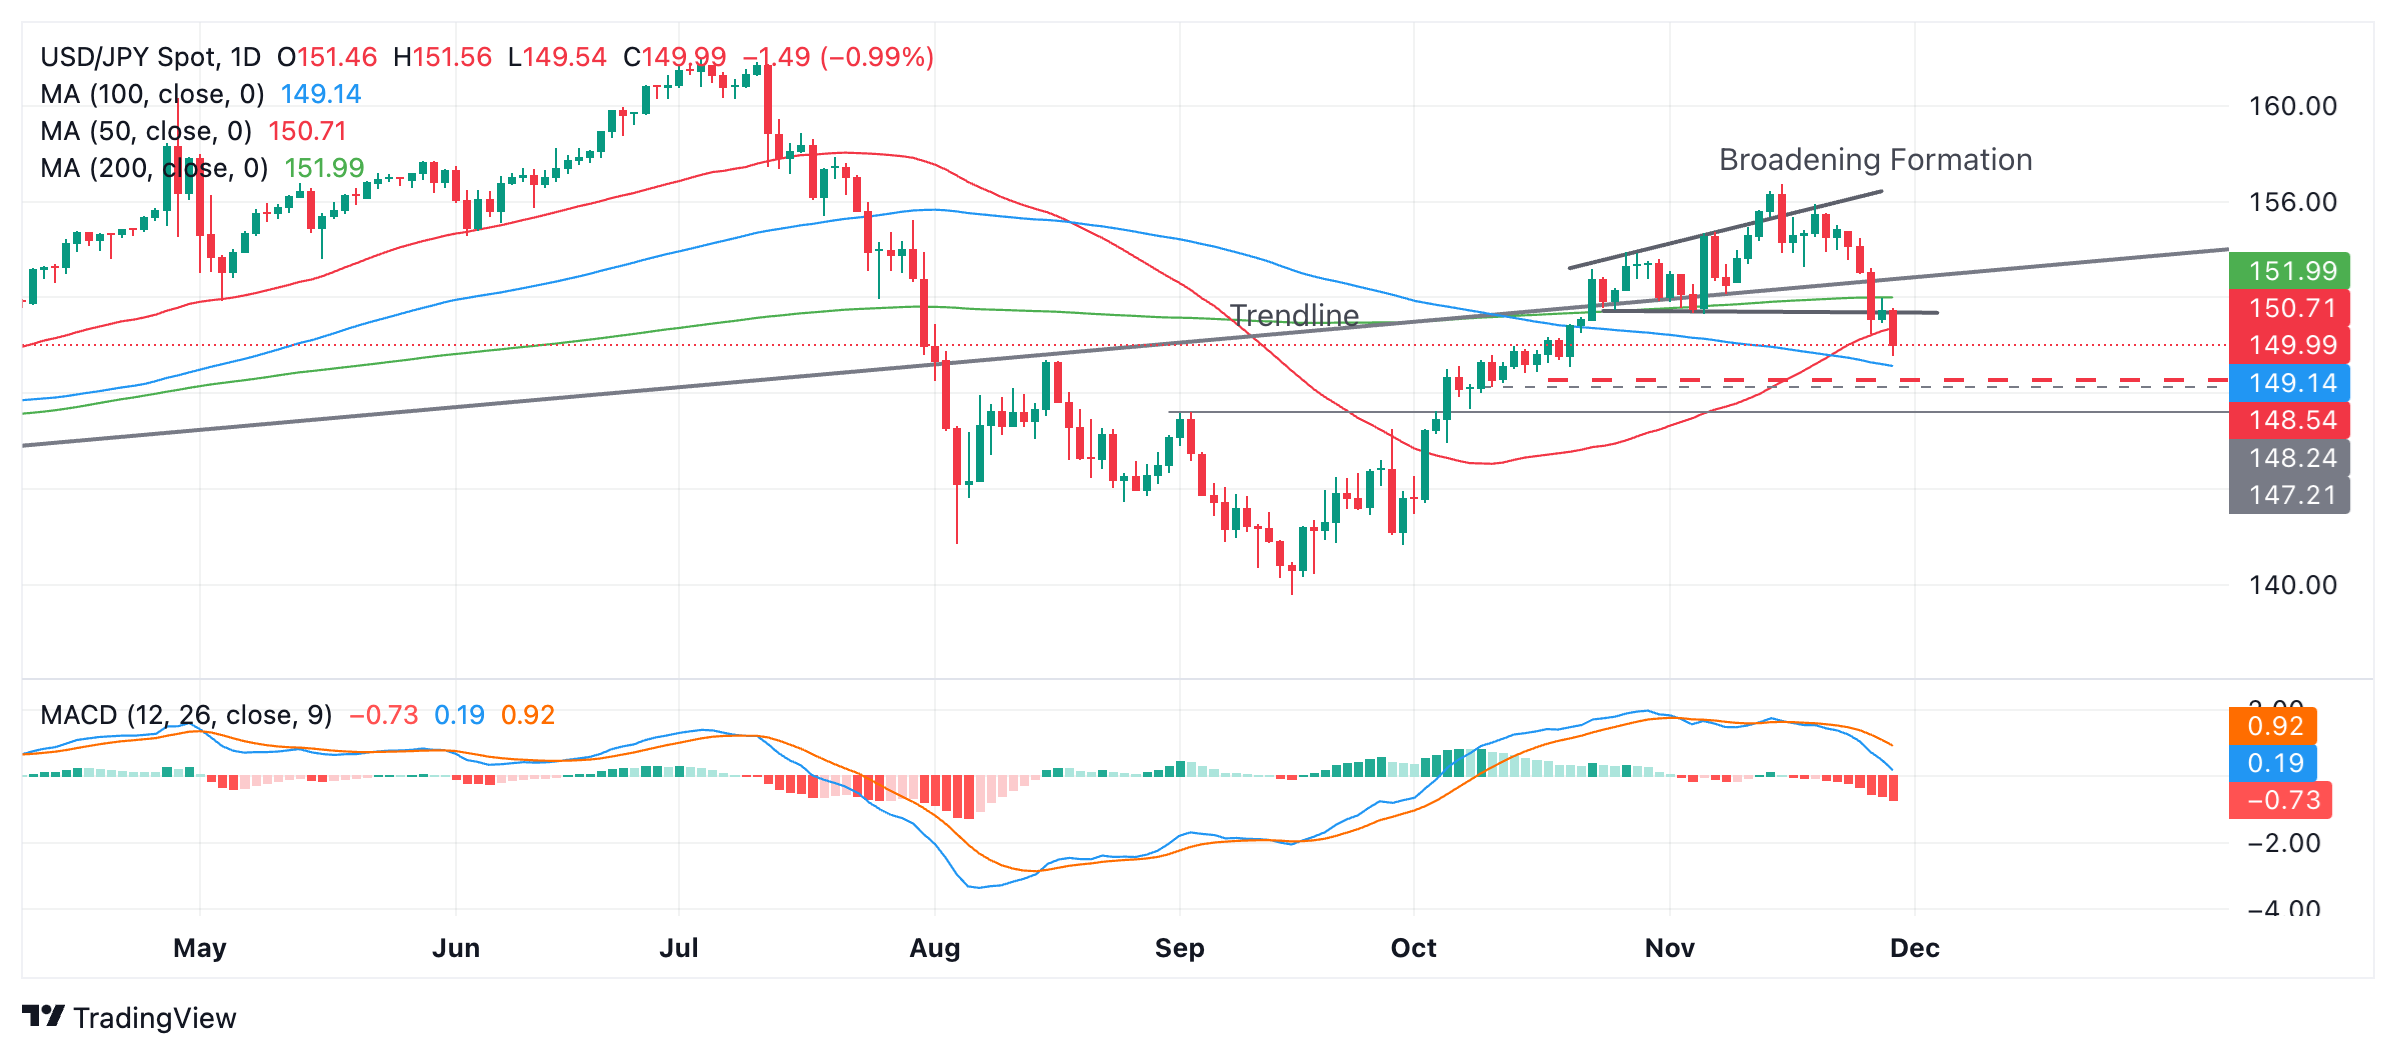
Further bearishness could carry USD/JPY to the next target at 148.24, the September 2, key swing high.
The (blue) Moving Average Convergence Divergence (MACD) momentum indicator is diverging away from its red signal line – a further bearish sign.
The short-term trend has probably reversed from bullish to bearish after the breakdown. Given it is a principle of technical analysis that trends have a tendency to extend, the odds now favor more weakness in the short-term.
More By This Author:
AUD/USD Holds Steady Above 0.6500, Lacks Bullish Conviction Amid Trade War Fears
Gold Price Pares Intraday Losses, Keeps The Red Amid Reviving USD Demand
EUR/CHF Price Prediction: Risks Further Downside To Target Despite Hammer Candle



Comments
Log in or sign up to join the conversation.