

EUR/CHF recovers after declining following a breakout from a Triangle pattern that started forming in August and completed in November (see chart).
The pair reached lows of 0.9204 on November 22 but promptly recovered to form a bullish reversal candlestick pattern called a bullish Hammer (green rectangle on chart below).
EUR/CHF Daily Chart
(Click on image to enlarge)
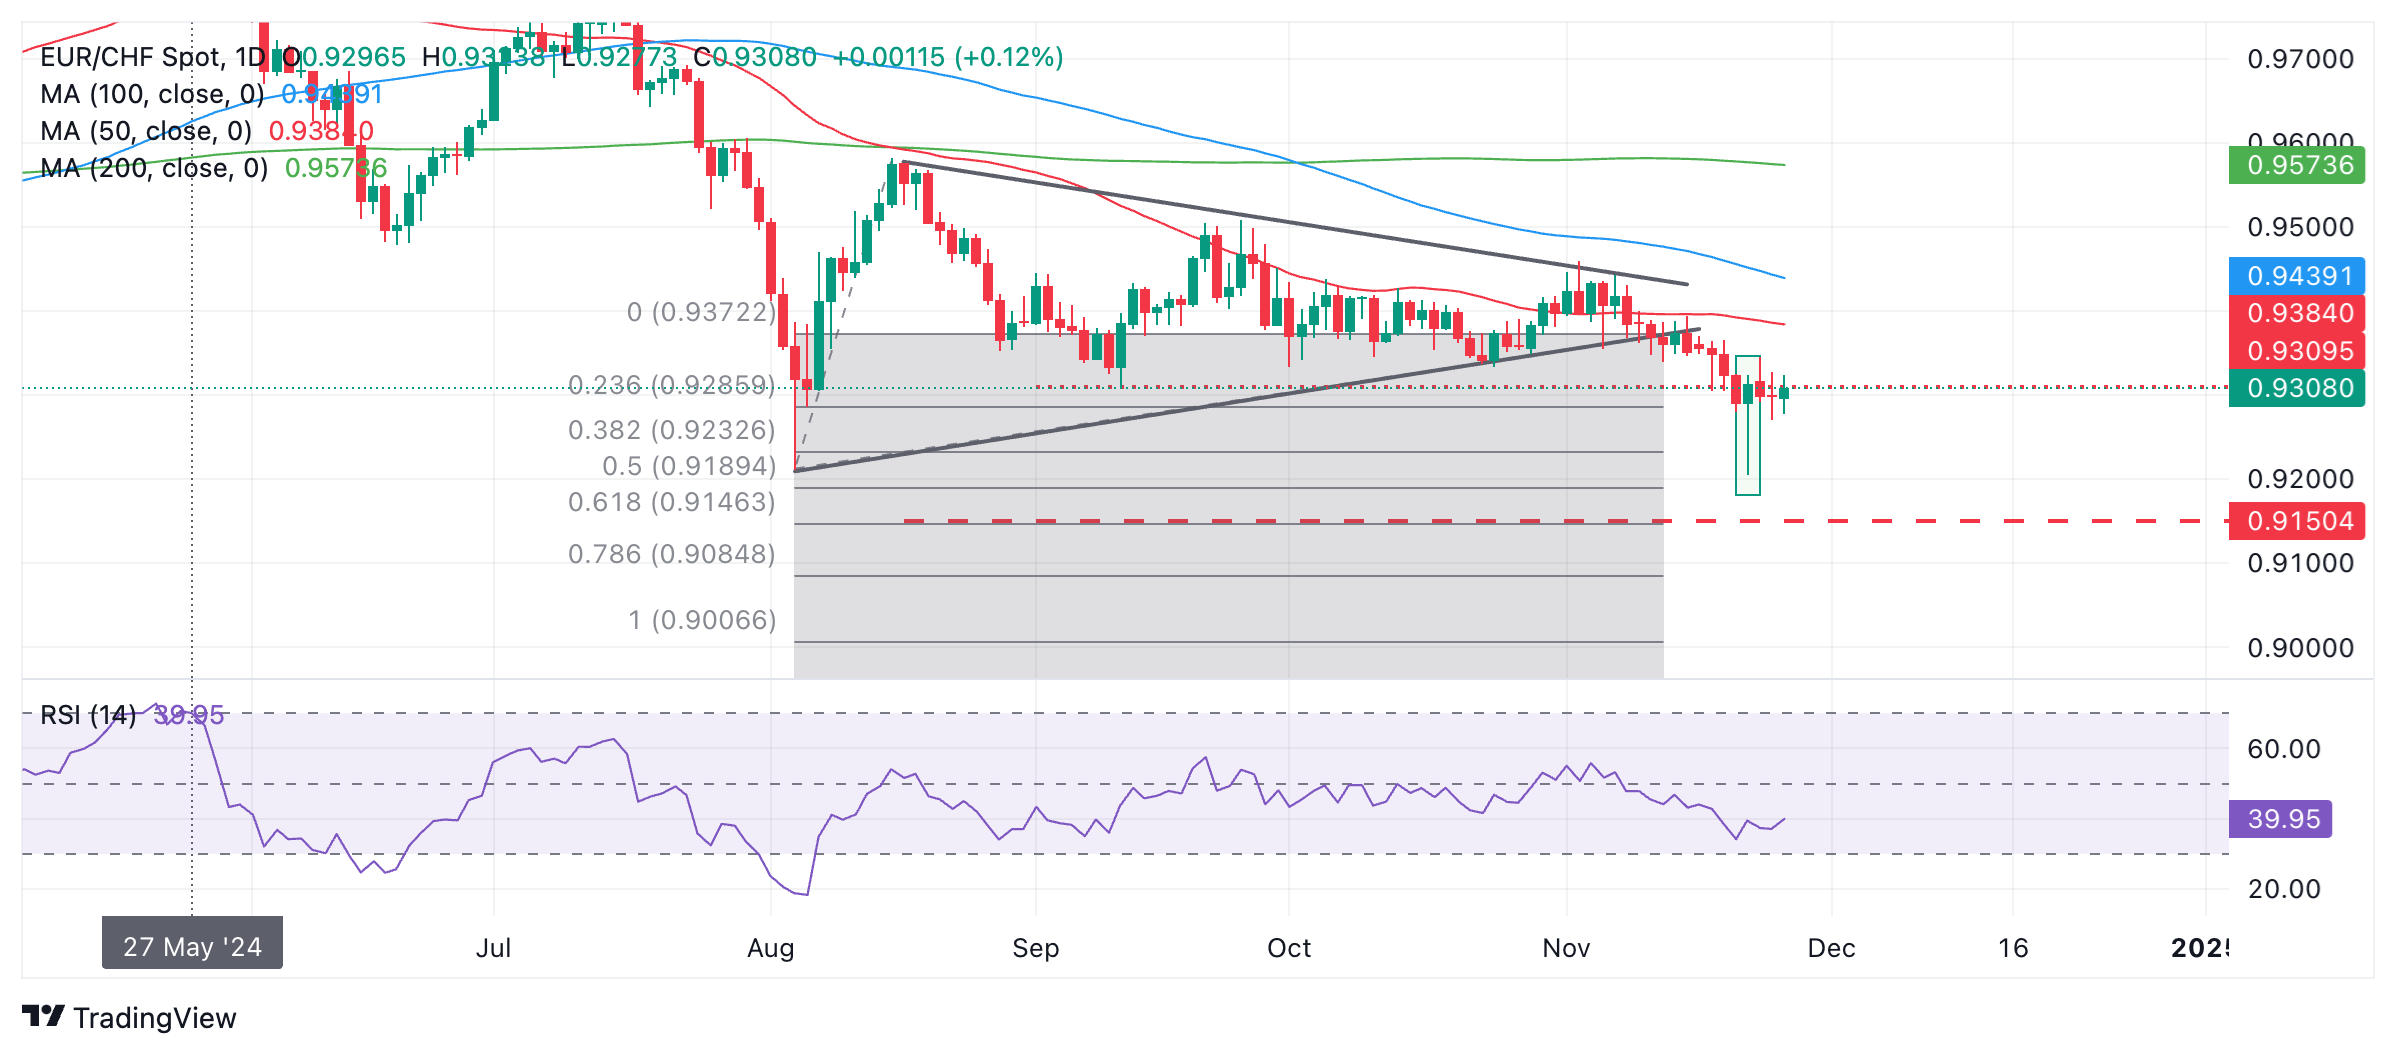
Despite being a classic example of a Hammer, the candle on EUR/CHF failed to gain bullish confirmation as it was not succeeded by a green up candle on the following day.
Since then the market has been going sideways.
There is still a risk EUR/CHF could resume falling again. It has not yet reached the conservative downside target for the Triangle at around 0.9146 (red dashed line), the 61.8% Fibonacci extrapolation of the height of the Triangle lower, and it is possible it may still fall down to that target in time.
A break below the Hammer’s lows at 0.9204 would increase the likelihood of the target being achieved.
More By This Author:
AUD/USD Bounces After Australian Trimmed Mean CPI Data, Fed Rate-Cut BetsUSD/CAD Spikes Above Multi-Year Range After Trump's 25% Tariff Threat
EUR/JPY Price Prediction: Down-trend In Play, Lower Lows Expected



Comments
Log in or sign up to join the conversation.