
USDCAD Is Nearing Strong Resistance
Photo by Michelle Spollen on Unsplash
USDCAD is in slow recovery on a daily chart, which clearly looks like an (A)-(B)-(C) corrective movement within wave B, where wave (C) can be slowly approaching the end within a wedge (ending diagonal) shape.
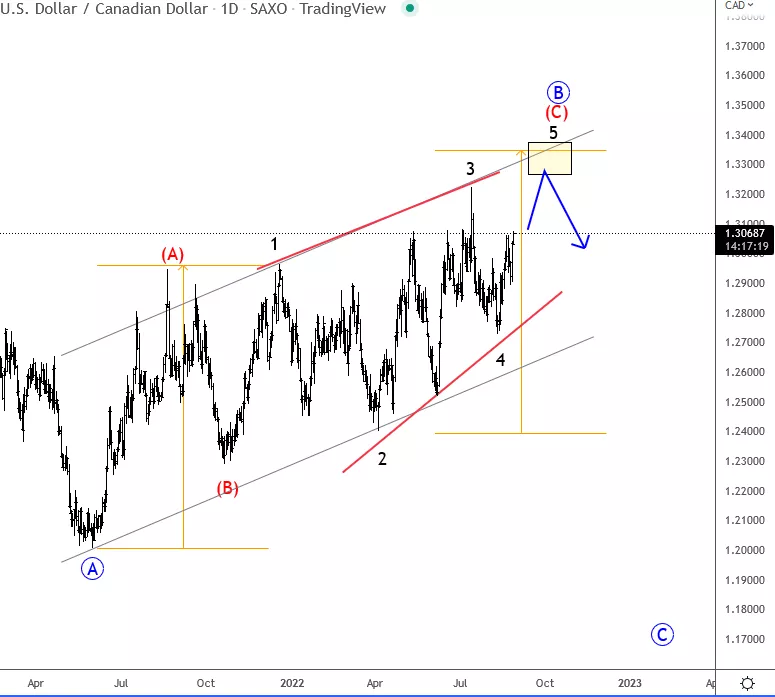
Wedge (ending diagonal) patterns consist of five waves 1-2-3-4-5 and we can see it moving within final leg 5 of (C). So, from a technical point of view, it can ideally stop around the 1.33 – 1.34 resistance area, and from there we will have to be aware of a strong bearish reversal back to lows.
More By This Author:
Bullish Turn On Crude Oil May Cause More Weakness For USD/CAD
S&P 500 In A Bullish Impulse
Stocks Outperforming Gold Again
Disclosure: Please be informed that information we provide is NOT a trading recommendation or investment advice. All of our work is for educational purposes only. Visit www.wavetraders.com for more ...
more

