

Today we will talk about the relationship between Crude oil and the USDCAD pair from a technical point of view and Elliott wave perspective. As we already know, they are in negative correlation as Canada has one of the largest oil reserves.
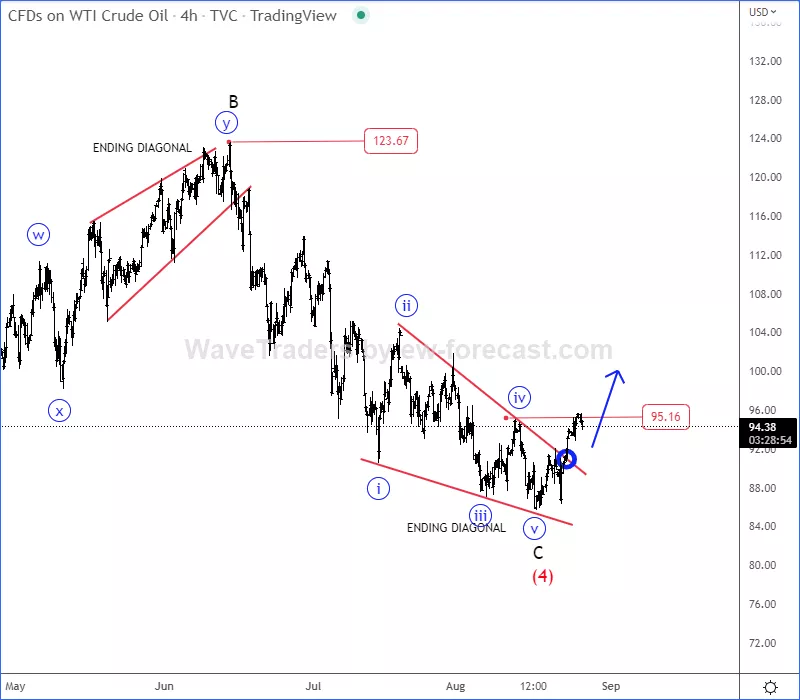
If we take a look on Crude oil chart, we can clearly see a completed ending diagonal (wedge) pattern within wave C of an A-B-C correction from the highs, and with recent break back above 95 level, seems like correction is completed and we can easily expect more gains.
(Click on image to enlarge)
Well, if Crude oil is really turning bullish, then the USDCAD currency pair could be upside limited if we respect negative correlation. Looking at the chart, we can see it finishing ending diagonal (wedge) pattern within wave (C) of an A-B-C correction in wave B that can cause a reversal down back to lows for wave C.
(Click on image to enlarge)
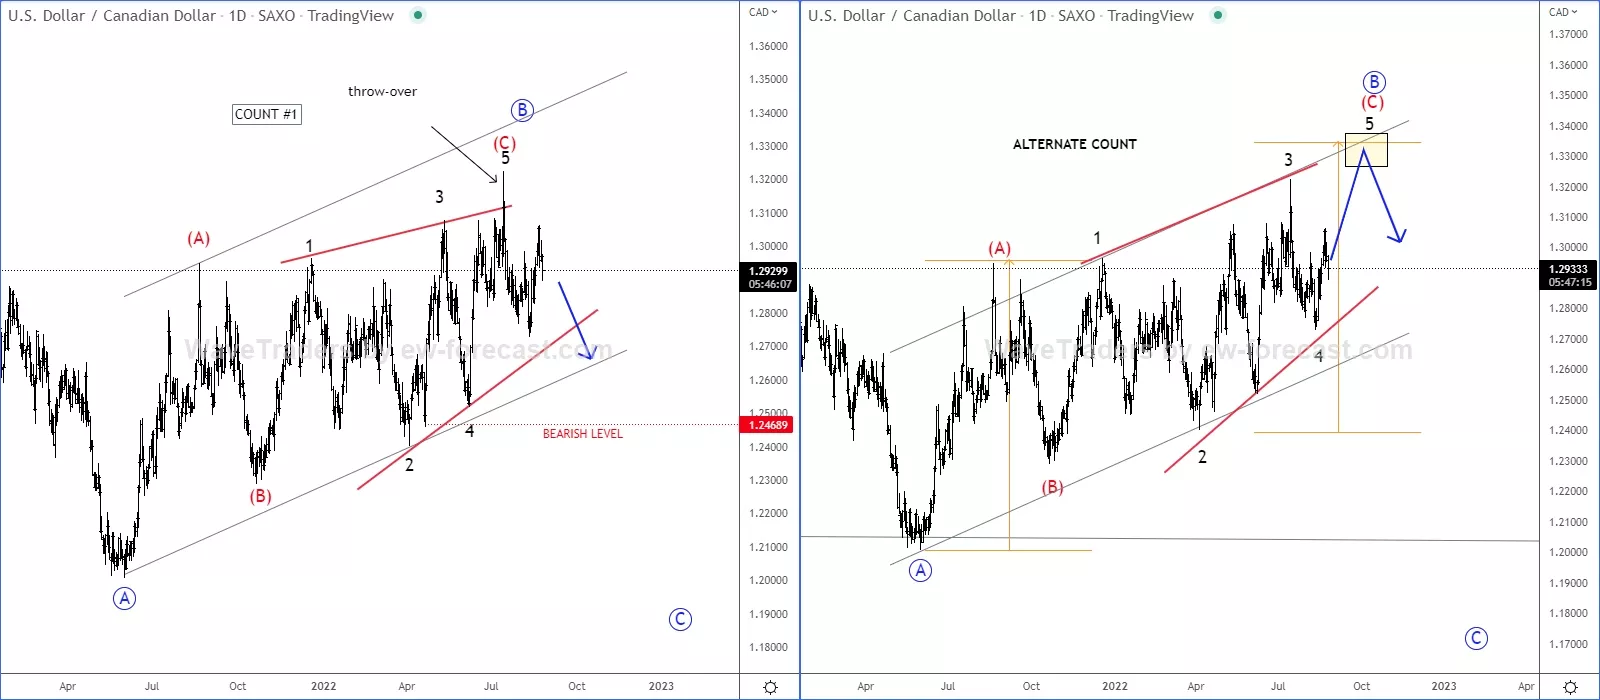
If we are on the right path, then Crude oil will stay up in upcoming days/weeks, while USDCAD can be looking for a bearish continuation.
More By This Author:
S&P 500 In A Bullish Impulse
Stocks Outperforming Gold Again
RavenCoin Shows Signs Of Life

Comments
Log in or sign up to join the conversation.