

Image Source: Pexels
- DXY remains under pressure and adds to Thursday’s losses.
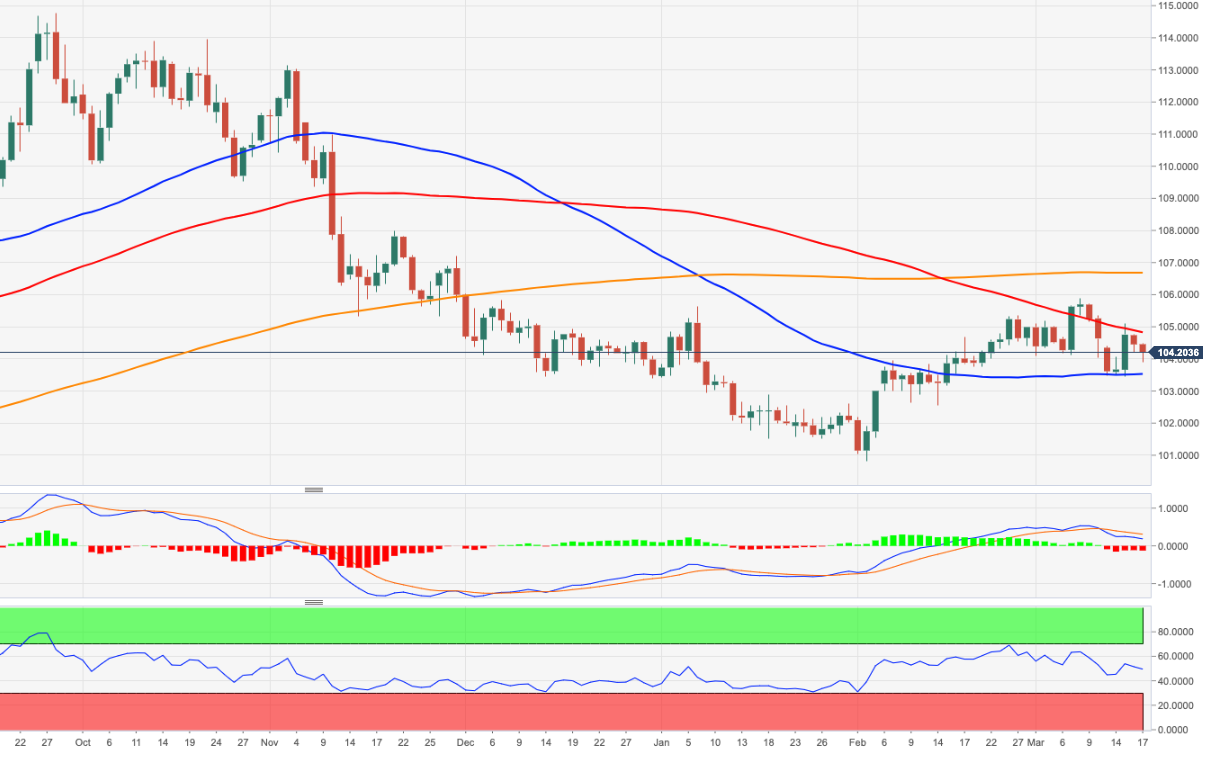
- There is decent contention around the March lows near 103.50.
DXY keeps the bearish tone well and sound in the second half of the week.
Further loss of momentum could prompt the dollar to revisit the area of recent lows near 103.50, which appears propped up by the temporary 55-day SMA. South from here, the index could challenge the weekly low at 102.58 (February 14).
Looking at the broader picture, while below the 200-day SMA (106.64), the outlook for the greenback is expected to remain negative.
DXY daily chart
(Click on image to enlarge)
Dollar Index Spot
| OVERVIEW | |
|---|---|
| Today last price | 104.19 |
| Today Daily Change | 55 |
| Today Daily Change % | -0.25 |
| Today daily open | 104.45 |
| TRENDS | |
|---|---|
| Daily SMA20 | 104.59 |
| Daily SMA50 | 103.45 |
| Daily SMA100 | 104.4 |
| Daily SMA200 | 106.84 |
| LEVELS | |
|---|---|
| Previous Daily High | 104.77 |
| Previous Daily Low | 104.2 |
| Previous Weekly High | 105.89 |
| Previous Weekly Low | 104.05 |
| Previous Monthly High | 105.36 |
| Previous Monthly Low | 100.81 |
| Daily Fibonacci 38.2% | 104.42 |
| Daily Fibonacci 61.8% | 104.55 |
| Daily Pivot Point S1 | 104.18 |
| Daily Pivot Point S2 | 103.9 |
| Daily Pivot Point S3 | 103.61 |
| Daily Pivot Point R1 | 104.75 |
| Daily Pivot Point R2 | 105.04 |
| Daily Pivot Point R3 | 105.32 |
More By This Author:
Natural Gas Futures: No Changes To The Consolidative Theme
USD Index Price Analysis: The Hunt For 105.00 And Above
EUR/USD Nose-Dives To 3-Day Lows And Threatens 1.0600


Comments
Log in or sign up to join the conversation.