USD Index Price Analysis: The Hunt For 105.00 And Above

Image Source: Pexels
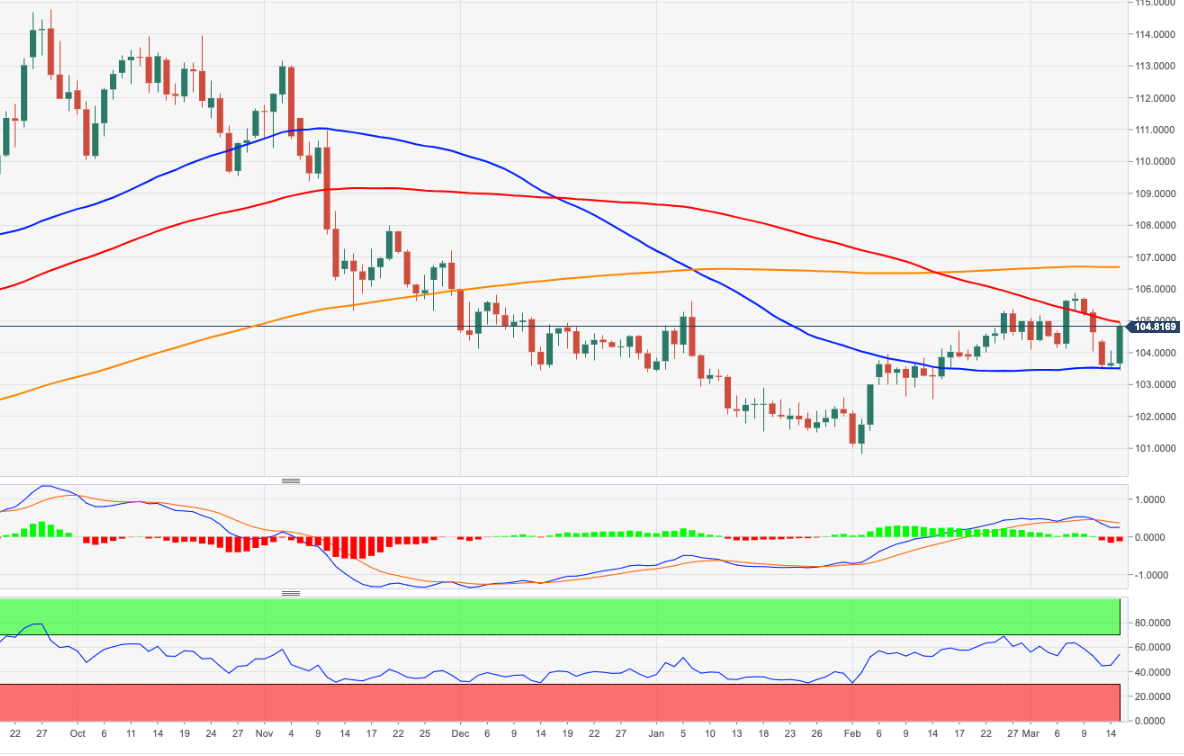
- DXY regains unusually strong upside traction and targets 105.00.
- The 100-day SMA at 104.95 emerges as the initial hurdle.
DXY gathers intense buying interest and climbs to 3-day highs near the 105.00 region on Tuesday, an area also underpinned by the temporary 100-day SMA.
The continuation of the strong rebound is expected to challenge the so-far 2023 high at 105.88 (March 8) prior to the key 200-day SMA, today at 106.64.
Looking at the broader picture, while below the 200-day SMA, the outlook for the greenback is expected to remain negative.
DXY daily chart
(Click on image to enlarge)
Dollar Index Spot
| OVERVIEW | |
|---|---|
| Today last price | 104.82 |
| Today Daily Change | 151 |
| Today Daily Change % | 1.11 |
| Today daily open | 103.67 |
| TRENDS | |
|---|---|
| Daily SMA20 | 104.53 |
| Daily SMA50 | 103.45 |
| Daily SMA100 | 104.49 |
| Daily SMA200 | 106.84 |
| LEVELS | |
|---|---|
| Previous Daily High | 104.06 |
| Previous Daily Low | 103.5 |
| Previous Weekly High | 105.89 |
| Previous Weekly Low | 104.05 |
| Previous Monthly High | 105.36 |
| Previous Monthly Low | 100.81 |
| Daily Fibonacci 38.2% | 103.85 |
| Daily Fibonacci 61.8% | 103.71 |
| Daily Pivot Point S1 | 103.43 |
| Daily Pivot Point S2 | 103.18 |
| Daily Pivot Point S3 | 102.87 |
| Daily Pivot Point R1 | 103.99 |
| Daily Pivot Point R2 | 104.3 |
| Daily Pivot Point R3 | 104.55 |
More By This Author:
EUR/USD Nose-Dives To 3-Day Lows And Threatens 1.0600
EUR/USD Comes Under Pressure And Pierces 1.0700 Ahead Of US CPI
USD Index Price Analysis: Initial Support Comes At The 55-Day SMA
Disclosure: Information on this article contains forward-looking statements that involve risks and uncertainties. Markets and instruments profiled on this page are for informational purposes ...
more


