

Image Source: Pixabay
- DXY intensifies the decline and breaches 104.00 on Monday.
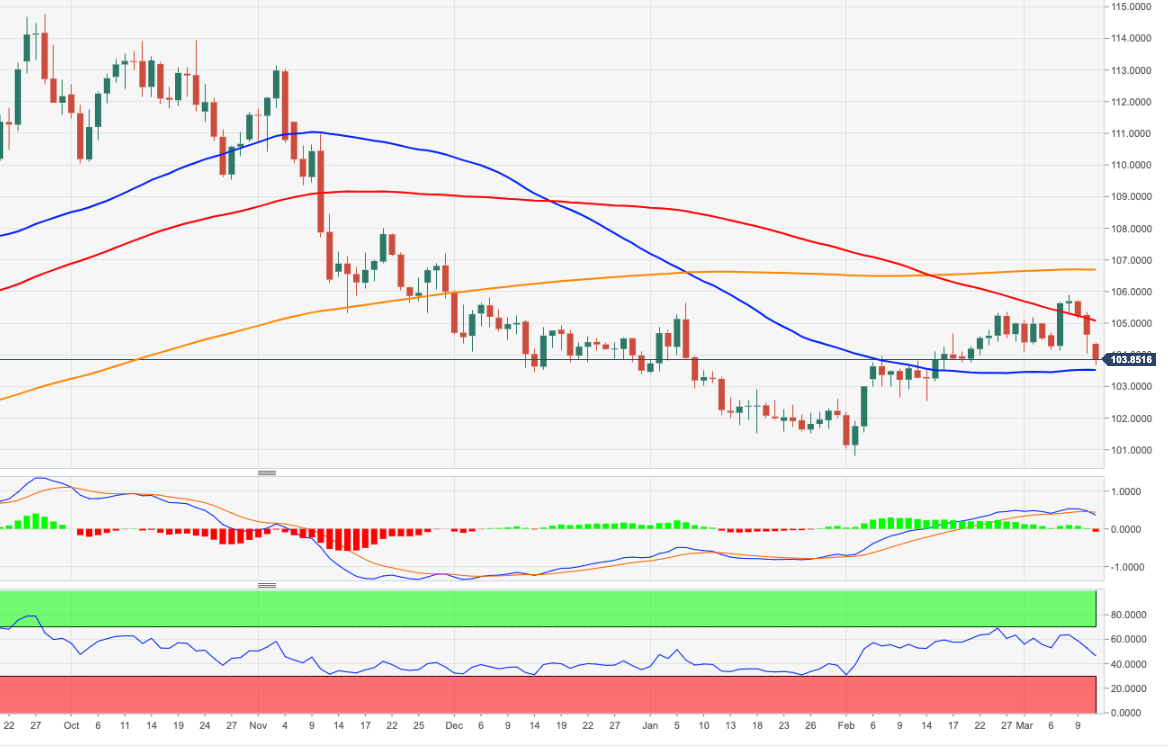
- The 55-day SMA near 103.50 should offer initial contention.
DXY extends the strong bearish momentum and breaks below the 104.00 support to record new multi-week lows.
In case sellers push harder, then the index should face a temporary support at the 55-day SMA at 103.51 prior to the weekly low at 102.58 (February 14).
In the meantime, while below the 200-day SMA at 106.62, the outlook for the greenback is expected to remain negative.
DXY daily chart
(Click on image to enlarge)
Dollar Index Spot
| OVERVIEW | |
|---|---|
| Today last price | 103.87 |
| Today Daily Change | 95 |
| Today Daily Change % | -0.74 |
| Today daily open | 104.64 |
| TRENDS | |
|---|---|
| Daily SMA20 | 104.49 |
| Daily SMA50 | 103.47 |
| Daily SMA100 | 104.61 |
| Daily SMA200 | 106.84 |
| LEVELS | |
|---|---|
| Previous Daily High | 105.36 |
| Previous Daily Low | 104.05 |
| Previous Weekly High | 105.89 |
| Previous Weekly Low | 104.05 |
| Previous Monthly High | 105.36 |
| Previous Monthly Low | 100.81 |
| Daily Fibonacci 38.2% | 104.55 |
| Daily Fibonacci 61.8% | 104.86 |
| Daily Pivot Point S1 | 104 |
| Daily Pivot Point S2 | 103.37 |
| Daily Pivot Point S3 | 102.69 |
| Daily Pivot Point R1 | 105.32 |
| Daily Pivot Point R2 | 105.99 |
| Daily Pivot Point R3 | 106.63 |
More By This Author:
Natural Gas Futures: Room For Further Decline
USD Index Deflates To 104.60 On Mixed US NFP
USD Index Holds On Above 105.00 Ahead Of NFP


Comments
Log in or sign up to join the conversation.