USD Index Price Analysis: Further Losses Not Ruled Out
- DXY extends the consolidative phase for yet another session.
- Extra retracements could see the 101.00 region breached near term.
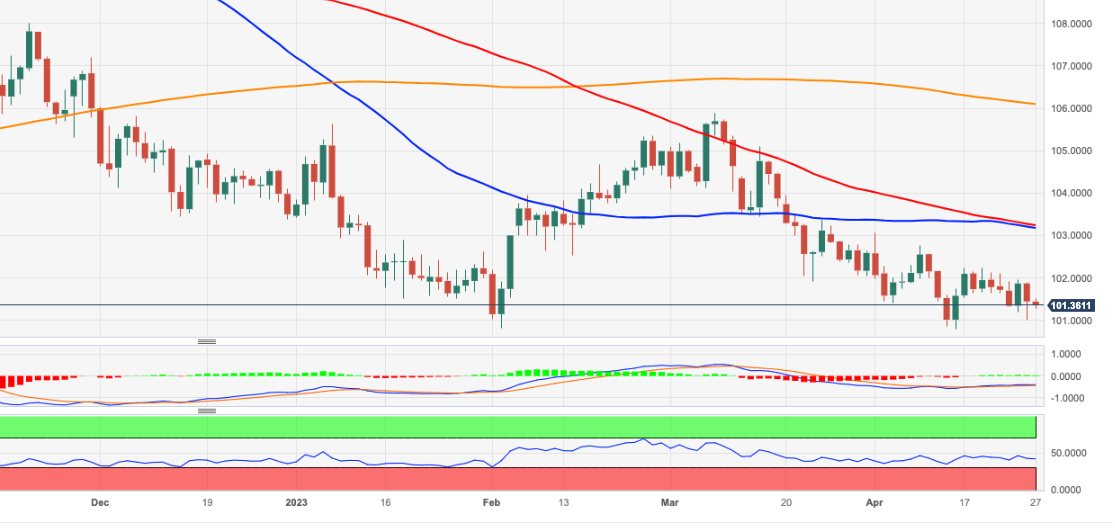
DXY alternates gains with losses in the low-101.00s on Thursday.
In the meantime, the index is expected to keep the choppy performance unchanged. The loss of the 101.00 region should spark further bouts of weakness to, initially, the 2023 lows in the 100.80/75 band (April 14).
Looking at the broader picture, while below the 200-day SMA, today at 106.10, the outlook for the index is expected to remain negative.
DXY daily chart
(Click on image to enlarge)
Dollar Index Spot
| OVERVIEW | |
|---|---|
| Today last price | 101.4 |
| Today Daily Change | 23 |
| Today Daily Change % | -0.05 |
| Today daily open | 101.45 |
| TRENDS | |
|---|---|
| Daily SMA20 | 101.86 |
| Daily SMA50 | 103.19 |
| Daily SMA100 | 103.28 |
| Daily SMA200 | 106.2 |
| LEVELS | |
|---|---|
| Previous Daily High | 101.89 |
| Previous Daily Low | 101.01 |
| Previous Weekly High | 102.23 |
| Previous Weekly Low | 101.53 |
| Previous Monthly High | 105.89 |
| Previous Monthly Low | 101.92 |
| Daily Fibonacci 38.2% | 101.35 |
| Daily Fibonacci 61.8% | 101.56 |
| Daily Pivot Point S1 | 101.01 |
| Daily Pivot Point S2 | 100.57 |
| Daily Pivot Point S3 | 100.13 |
| Daily Pivot Point R1 | 101.89 |
| Daily Pivot Point R2 | 102.33 |
| Daily Pivot Point R3 | 102.77 |
More By This Author:
Crude Oil Futures: Door Open To Extra Decline
USD Index Price Analysis: No Changes To The Consolidative Theme
Crude Oil Futures: A Deeper Drop Is Not Favored
Disclosure: Information on this article contains forward-looking statements that involve risks and uncertainties. Markets and instruments profiled on this page are for informational purposes ...
more


