
- DXY comes under pressure amidst choppy price action this week.
- The loss of 101.00 could open the door to a probable test of the YTD low.
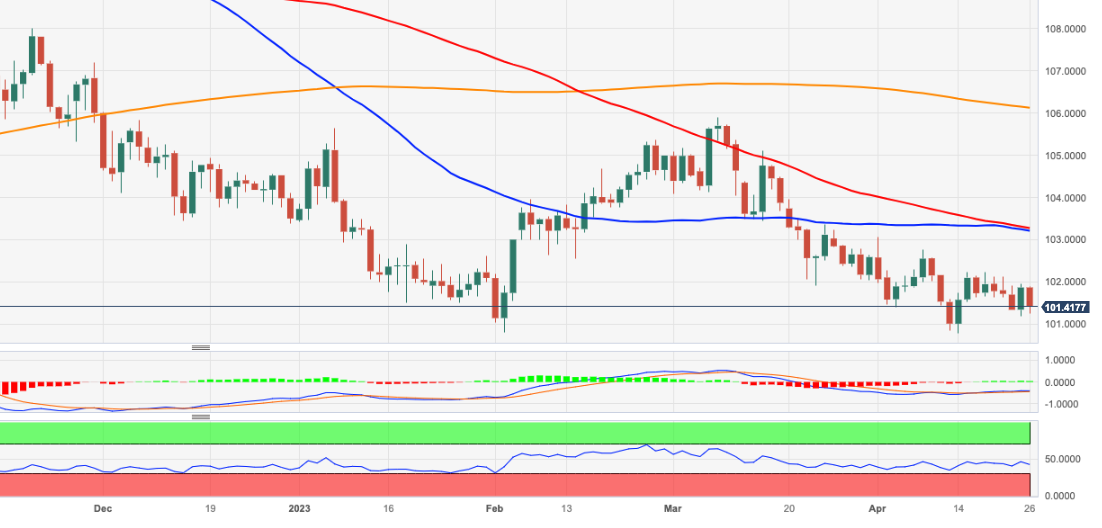
DXY fades part of Tuesday’s acute rebound and return to the 101.40/50 region on Wednesday.
The recent choppy performance in the index seems to have now refocused back on the downside. Against that, DXY could cling to this consolidative theme ahead of a probable drop to the 101.00 zone. The loss of the latter could expose a move to the so far 2023 lows near 100.80 (April 14).
Looking at the broader picture, while below the 200-day SMA, today at 106.12, the outlook for the index is expected to remain negative.
DXY daily chart
(Click on image to enlarge)
Dollar Index Spot
| OVERVIEW | |
|---|---|
| Today last price | 101.45 |
| Today Daily Change | 65 |
| Today Daily Change % | -0.41 |
| Today daily open | 101.87 |
| TRENDS | |
|---|---|
| Daily SMA20 | 101.92 |
| Daily SMA50 | 103.24 |
| Daily SMA100 | 103.31 |
| Daily SMA200 | 106.22 |
| LEVELS | |
|---|---|
| Previous Daily High | 101.95 |
| Previous Daily Low | 101.2 |
| Previous Weekly High | 102.23 |
| Previous Weekly Low | 101.53 |
| Previous Monthly High | 105.89 |
| Previous Monthly Low | 101.92 |
| Daily Fibonacci 38.2% | 101.66 |
| Daily Fibonacci 61.8% | 101.48 |
| Daily Pivot Point S1 | 101.39 |
| Daily Pivot Point S2 | 100.92 |
| Daily Pivot Point S3 | 100.64 |
| Daily Pivot Point R1 | 102.15 |
| Daily Pivot Point R2 | 102.43 |
| Daily Pivot Point R3 | 102.9 |
More By This Author:
Crude Oil Futures: A Deeper Drop Is Not FavoredUSD Index Price Analysis: A Drop Below 101.00 Remains Likely
Natural Gas Futures: Further Range Bound On The Cards


Comments
Log in or sign up to join the conversation.