
- The Greenback keeps falling on Thursday as markets choke on Trump’s tariffs implementation.
- President Trump announced a base 10% tariff for all countries exporting goods to the US and additional levies per country.
- The US Dollar Index is hit hard and falls below the 102.00 level and even nears 101.50.
The US Dollar Index (DXY), which tracks the performance of the US Dollar (USD) against six major currencies, is undergoing another seismic shift again, trading at levels not seen since early October around 101.500 and correcting near 2.00% at the time of writing on Thursday. The US Dollar is being kicked out of portfolios while investors repatriate cash as they sell their stakes in US Equities amidst a harsh correction globally.
Markets are digesting the reciprocal tariffs that were implemented overnight by the United States (US) President Donald Trump, where a global 10% tariff is the minimum base case for the 60 countries that are exporting to the US. From there, all other earlier tariffs remain in place, which means, for example, a total of 54% tariff on China applicable as of this Thursday. Meanwhile, the daily economic calendar continues with the US weekly Jobless Claims, ISM Services print and the Challenger Job Cuts for March to be released.
Daily digest market movers: Data turning further
- Treasury Secretary Scott Bessent commented, after the announcement of reciprocal tariffs by Trump, that tariffs could quickly be lifted or removed if countries bring back their production to the US. Bessent issued a statement as well, saying that it’s best for countries not to retaliate as this could be considered the worst-case scenario if they want to avoid more tariffs.
- The US Challenger Job Cuts for March are seeing further cuts, coming in at 275,240 with the previous release at 172,017.
- The US weekly Jobless Claims data is due. Initial Claims came in stronger at 219,000, beating the 225,000 estimate and coming from 224,000. The Continuing Claims jumped to 1.903 million, higher than the 1.856 million previously.
- At 13:45 GMT, US S&P Global will release the final Services Purchasing Managers’ Index (PMI) reading for March. Expectations are for a steady 54.3.
- At 14:00 GMT, the US Institute for Supply Management (ISM) will release the March Services report:
-
- Services PMI is expected to drop to 53.0, coming from 53.5.
- No forecast available for the Employment component with the previous reading at 53.9.
- New Orders has no survey available, it came in at 52.2 previously.
- Prices Paid has no forecast available either, with the previous reading at 62.6.
- Equities are facing sharp corrections on the back of the overnight headlines. European futures are down between 1% and 2%, while US ones are down even more than 4% – for example, the Nasdaq – before the opening bell.
- According to the CME Fedwatch Tool, the probability of interest rates remaining at the current range of 4.25%-4.50% in May’s meeting is 74.7%. For June’s meeting, the odds for borrowing costs being lower stand at 72.5%.
- The US 10-year yields trade around 4.03%, a fresh five-month low as a massive flight to safe haven Bonds is taking place.
US Dollar Index Technical Analysis: No stops along the way
The US Dollar Index (DXY) is finally coming alive after consolidating around the 103.00-104.00 range for nearly a month. With this shock effect in markets, the DXY falls below the 102.00 cushion and tests the support of the 101.90 technical level on Thursday. Once that level breaks, another chunky area will open up for further devaluation of the Greenback, with the 100.00 round level as a downside target.
With the sizable downward move on Thursday, some support levels have turned into resistance. The first level to watch out for comes in at 103.18, which has held as support throughout March. Above there, the 104.00 pivotal level and the 200-day Simple Moving Average (SMA) at 104.90 come into play.
On the downside, 101.90 is the first line of defense, and it should be able to trigger a bounce as the Relative Strength Index (RSI) momentum indicator is issuing warnings of oversold conditions in the daily chart. Maybe not this Thursday, but in the coming days, a break below 101.90 could see a leg lower towards 100.00.
(Click on image to enlarge)
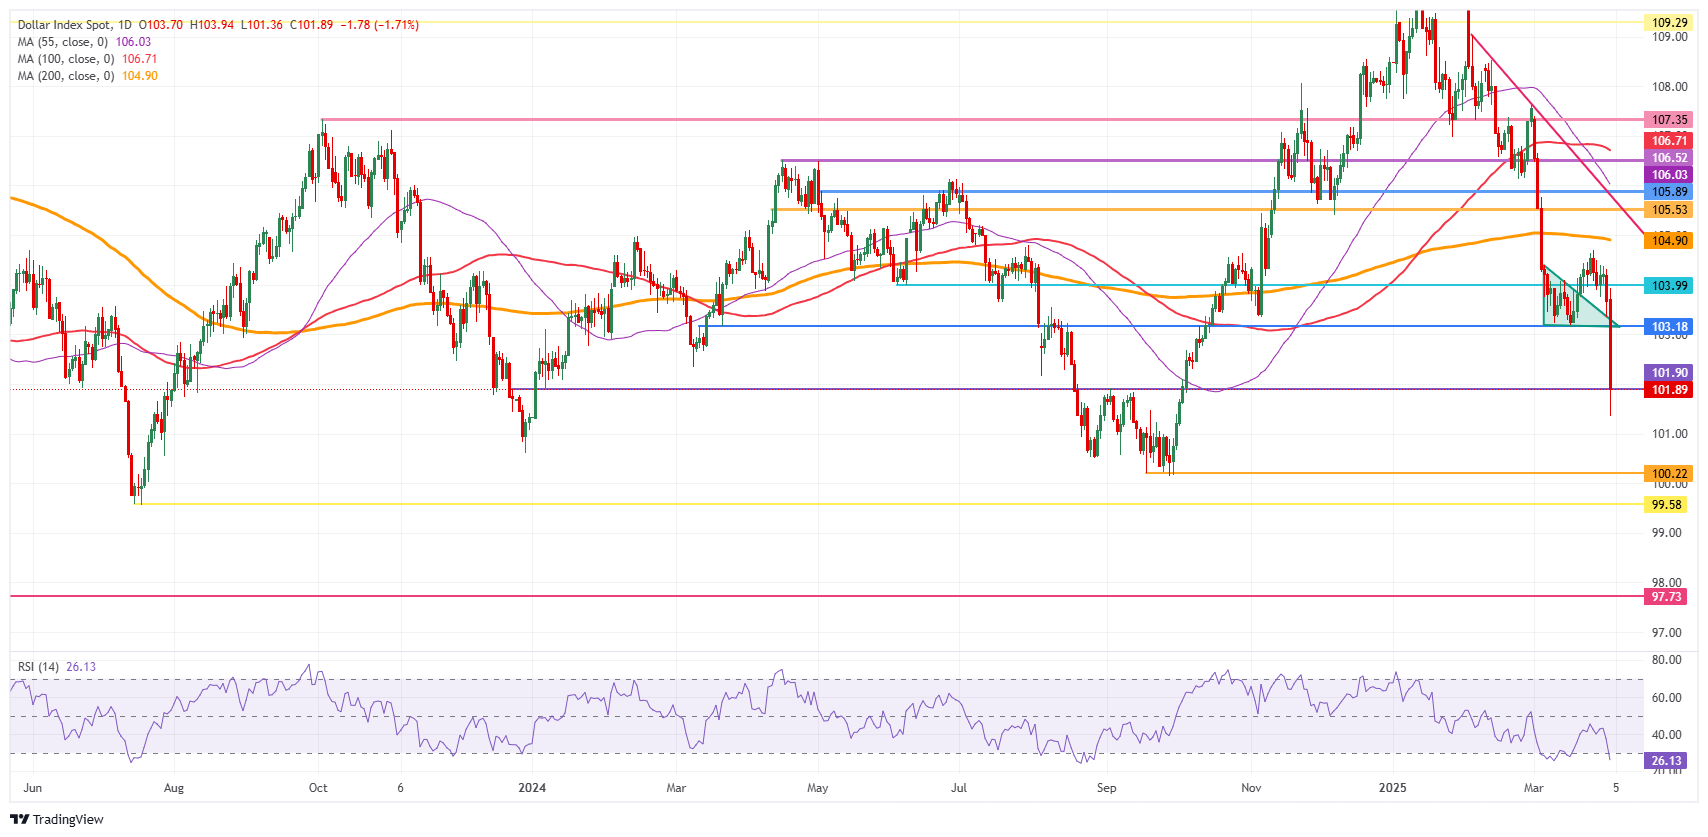
US Dollar Index: Daily Chart
More By This Author:
Gold Price Briefly Becomes Falling Knife With Selling Pressure Picking UpUS Dollar Sees Markets Ignore Upbeat ADP Number
US Dollar Sees Little Upmove While Markets Try To Grasp Impact Of US Tariff Liberation Day
Comments
Log in or sign up to join the conversation.