
We discussed the long-term view of US dollar index and mentioned the technical weakness on the long-term chart of the US dollar a few months ago. US dollar bounces from the long term inflection levels and now hits the first resistance before the FOMC meetings last week. Today we will discuss the US dollar forecast with the correlated pairs of EURUSD, USDCAD and USDJPY.

US Dollar Forecast
The yearly chart below shows that the US dollar's long-term outlook is bearish. The 2020 yearly candle hits the 16-year cycle top at the red arc resistance, resulting in a reversal candle. The reversal from the red arc resistance implies that the US dollar index will fall further in 2021.
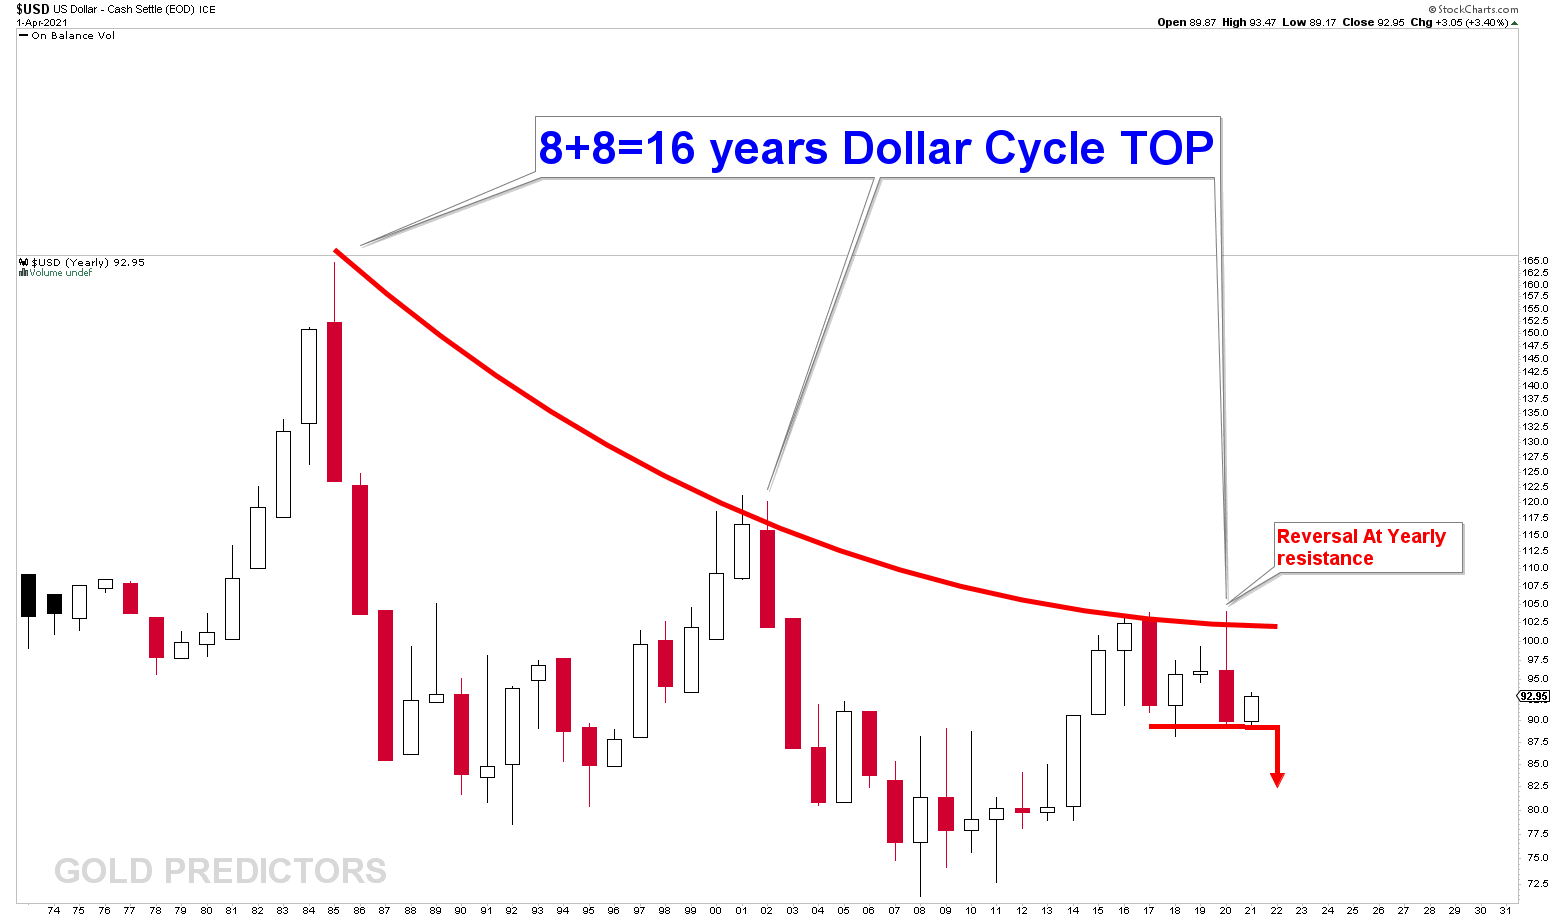
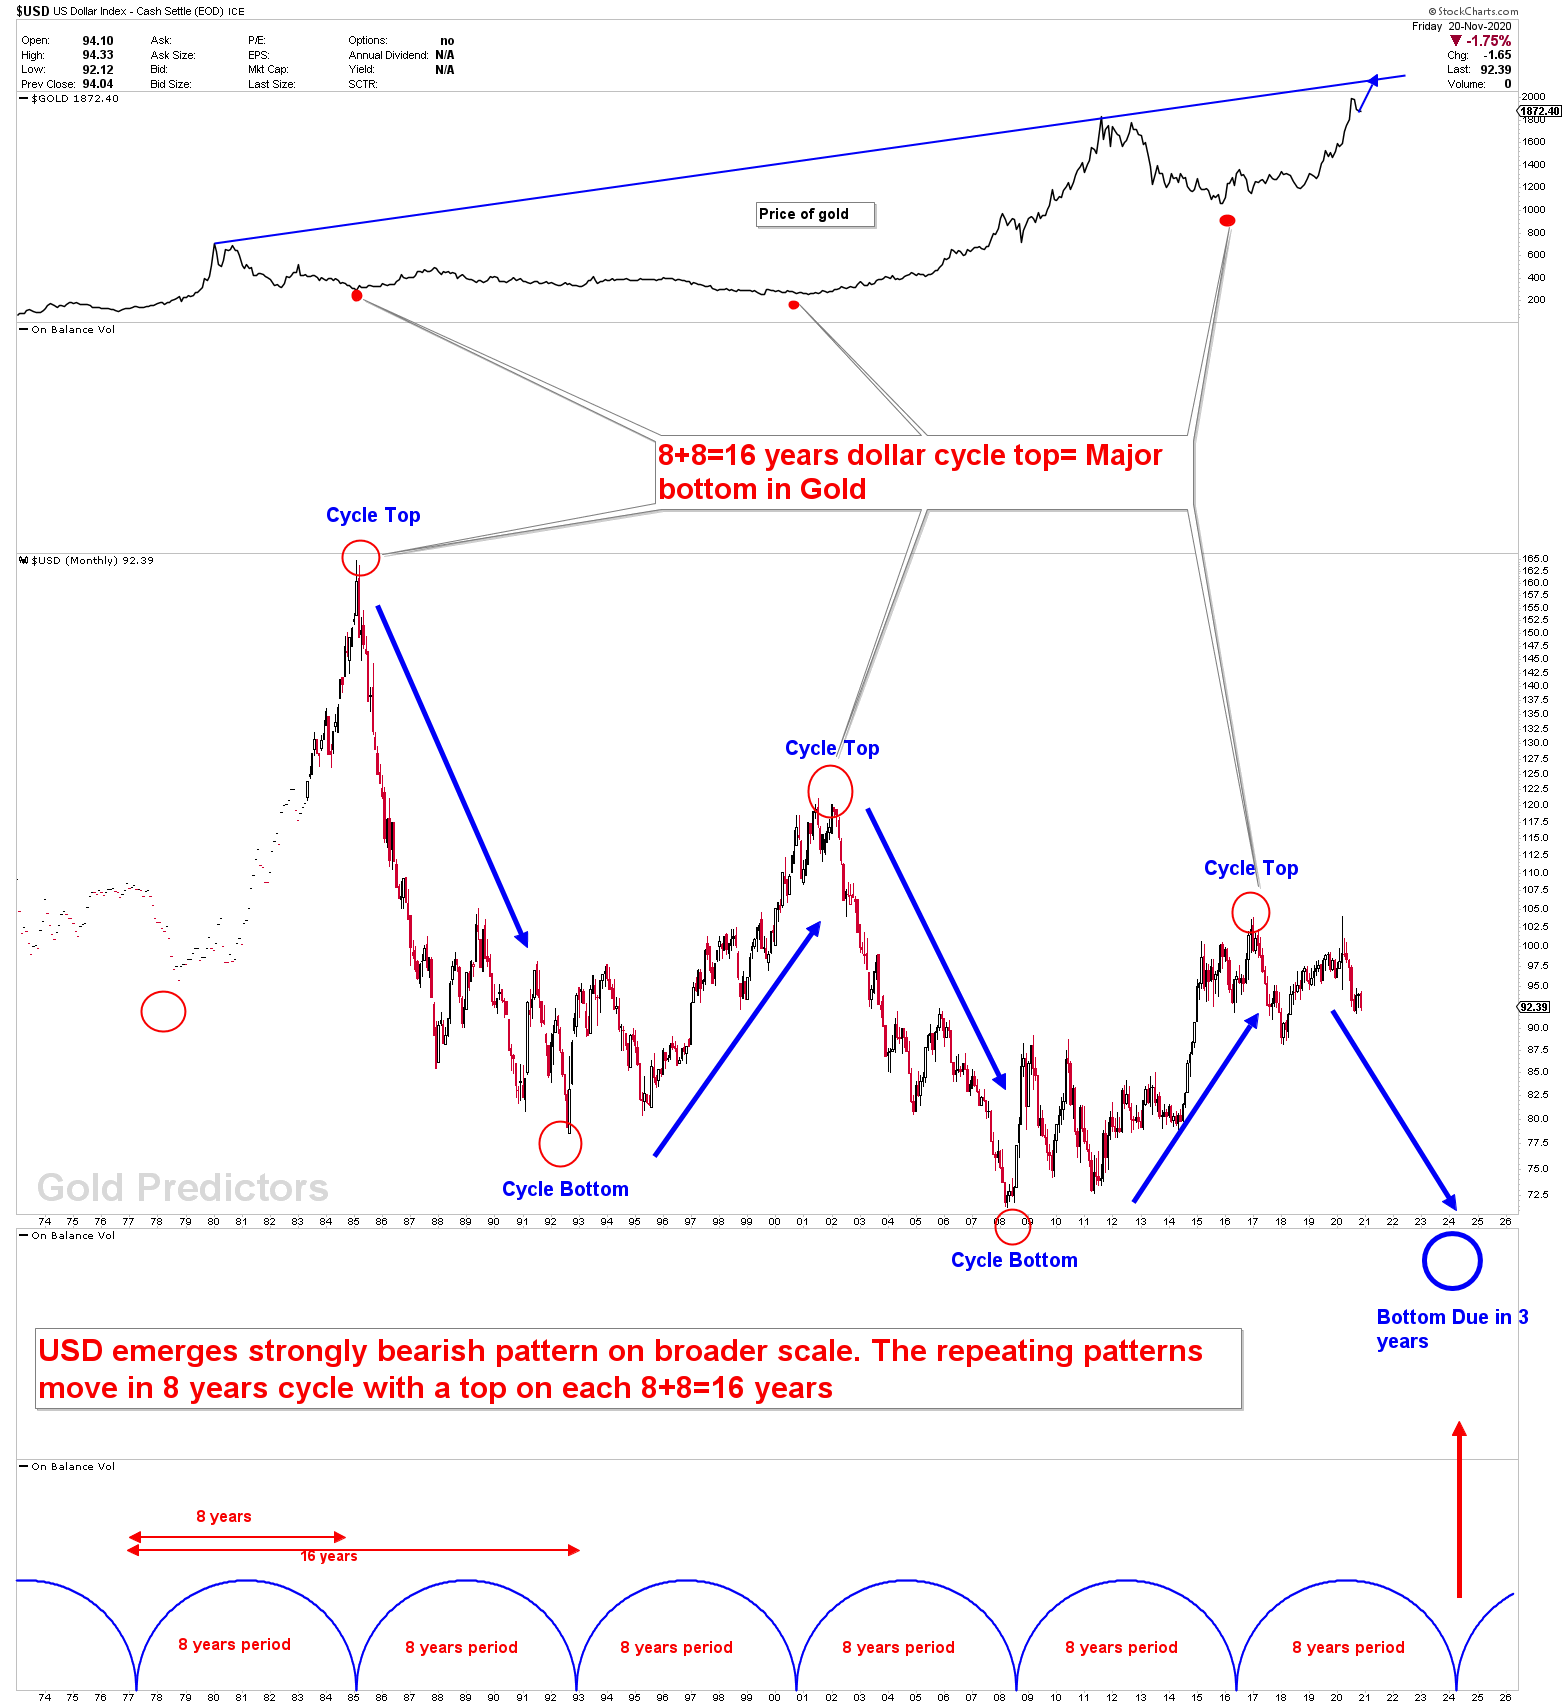
In US dollars, the 16-year cycle is divided into 8-year cycles. Every alternate 8-year cycle, the US dollar produces a top followed by a subsequent bottom for the following 8 years. This 8-year cycle is clearly visible in the gold market. Since gold and the dollar are inversely proportional with a 70-90% probability over the last 50 years statistics, the gold market produced a clear bottom with every top in the dollar long term cycle. When we raised the issue of a major bottom in gold markets in December 2015, with a $1,000 bottom for a projected $8,000 rally, everyone was doubtful. Within 4-5 years, spot gold reaches $2,070 and has increased in value by nearly 100% from our forecasted point. On the other hand, the US dollar index did not decline much in value, but it did produce some volatile ranges with strong bearish patterns. This suggests that any upcoming drop in the value of the US dollar will ignite a boom in the gold and silver markets, with another 100% increase in value.
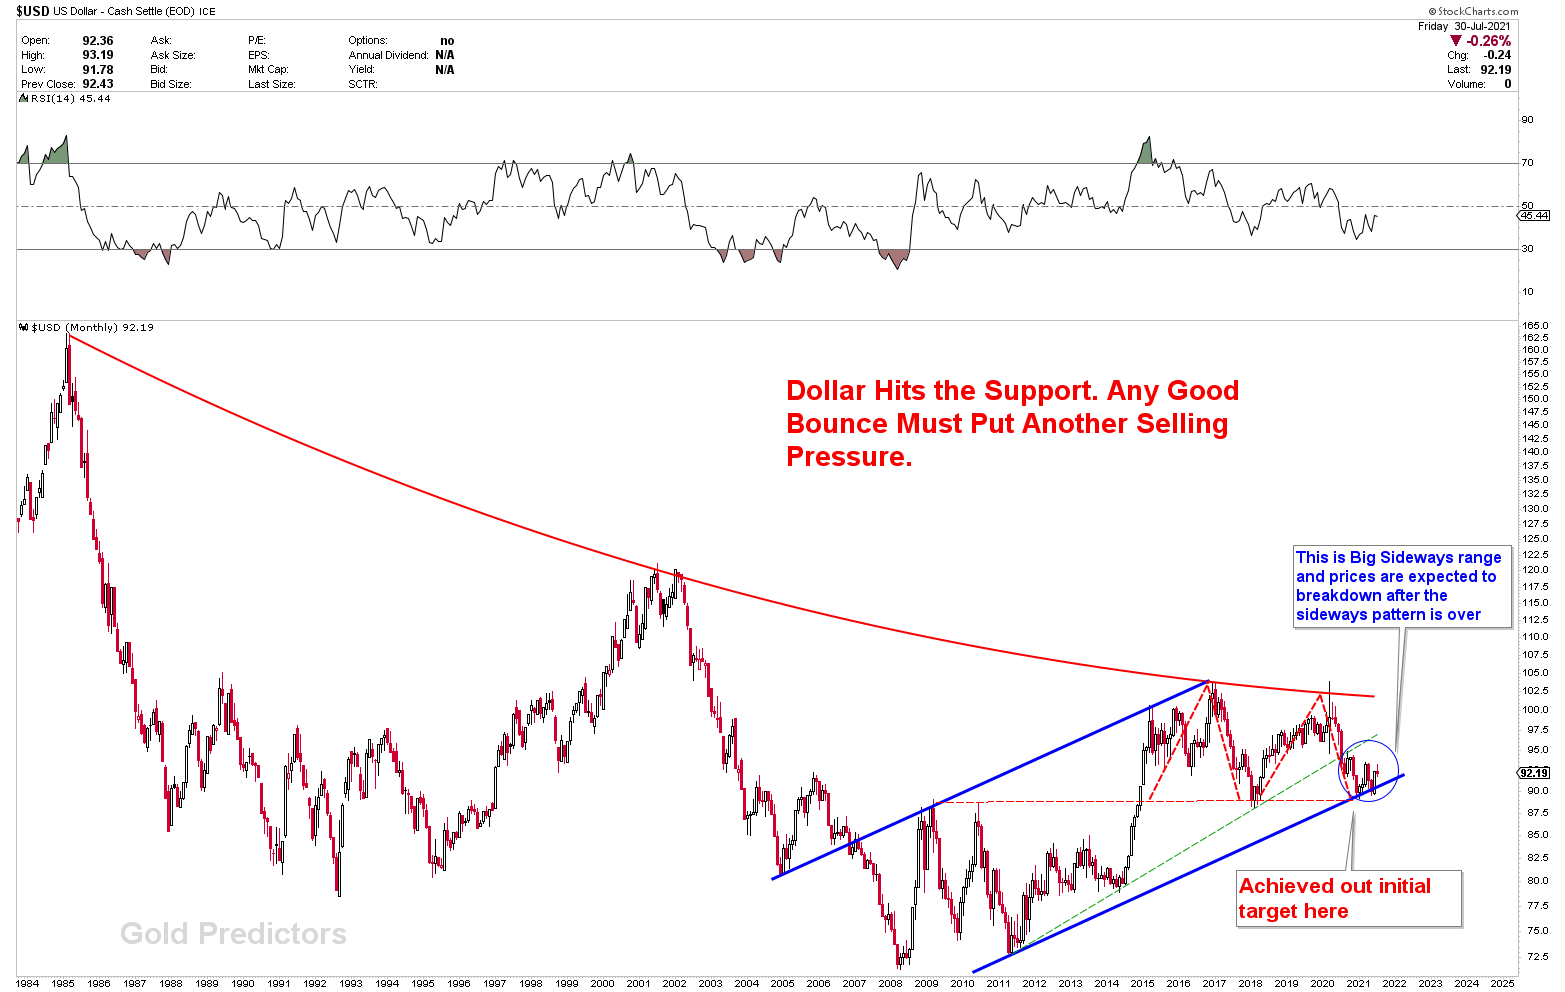
Let’s zoom in on the US dollar bearish pattern on the monthly charts to see the formations at critical levels. We've been using the same chart to show the various scenarios for the US dollar index. According to the chart, the perfect hit at the 16-year cycle top in the US dollar resulted in a double top at the red arc resistance. This double top can also be seen using the M type patterns, which are strongly bearish. The blue rising channel was attained in 2021, and a bounce from this support is currently underway. According to the chart below, this region of support is also promoted by the red horizontal support, which has now become the neckline of the bearish M top. Any breach of this neckline would result in a dramatic decline in the US dollar index. So far, the bounce from this strong support has been weak, indicating a period of sideways movement before a drop. The US dollar is likely to fall sharply once the sideways range ends. This drop in the US dollar would be aided by the 16-year cycle top.
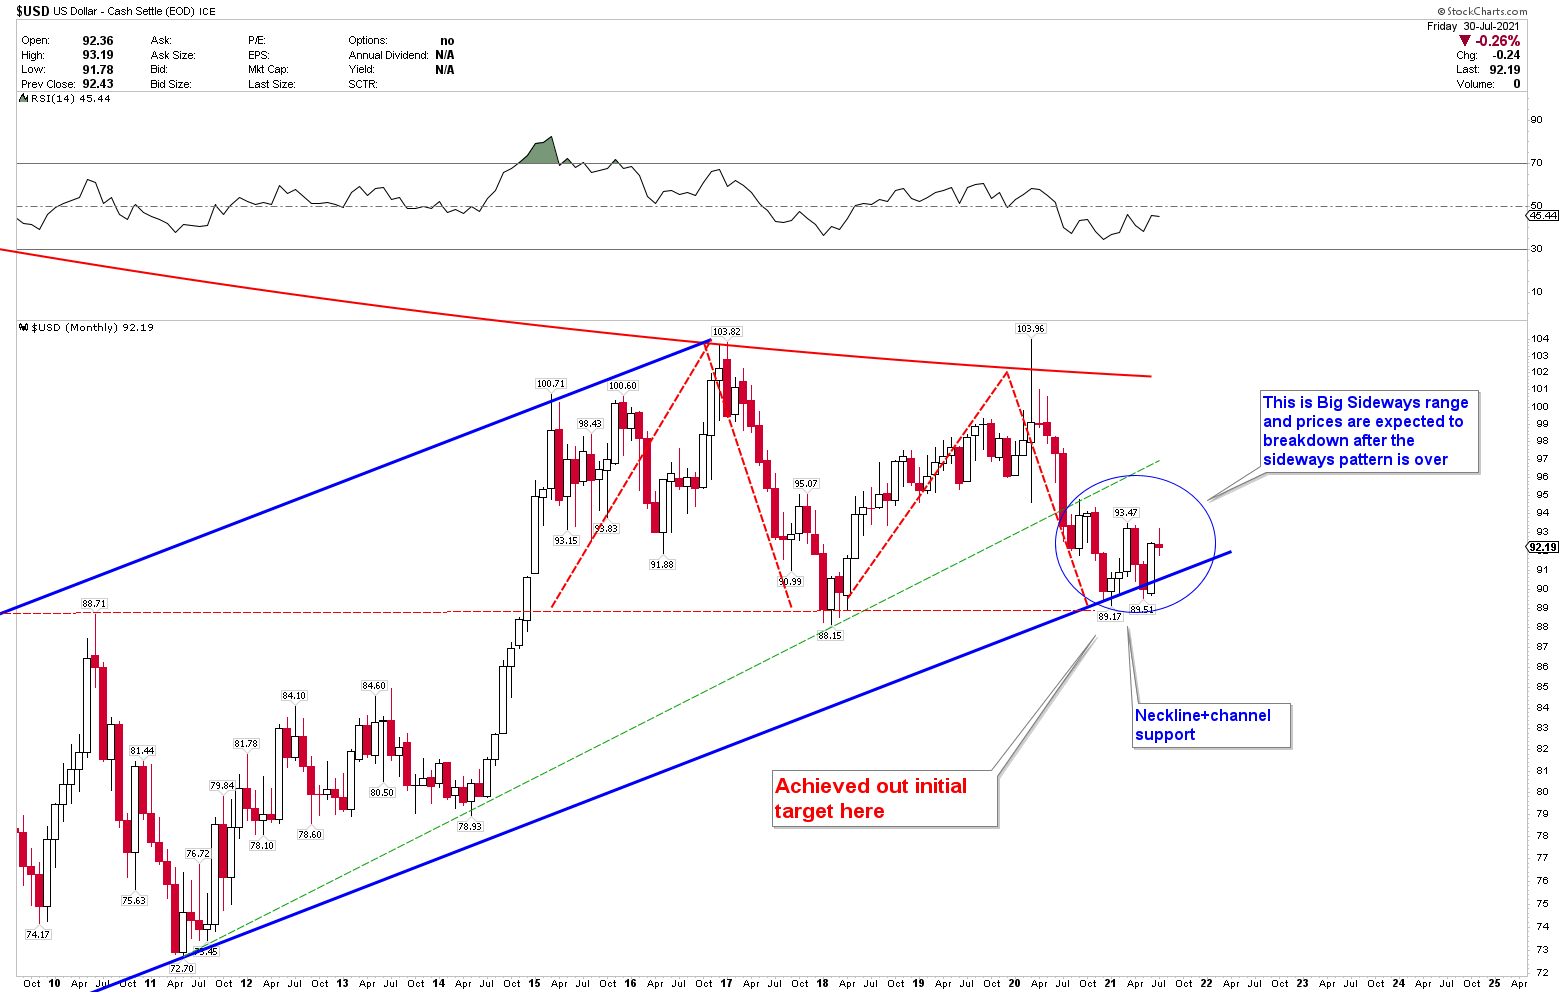
Let's magnify the chart to view it more clearly. The chart below shows a strong sideways region between 94 and 89. Any breach of 89 would result in a precipitous drop in the index. Other correlated markets are likely to fake out and be risky with large volatile ranges as long as the US dollar index remains sideways. The summer doldrums help to support these volatile ranges.
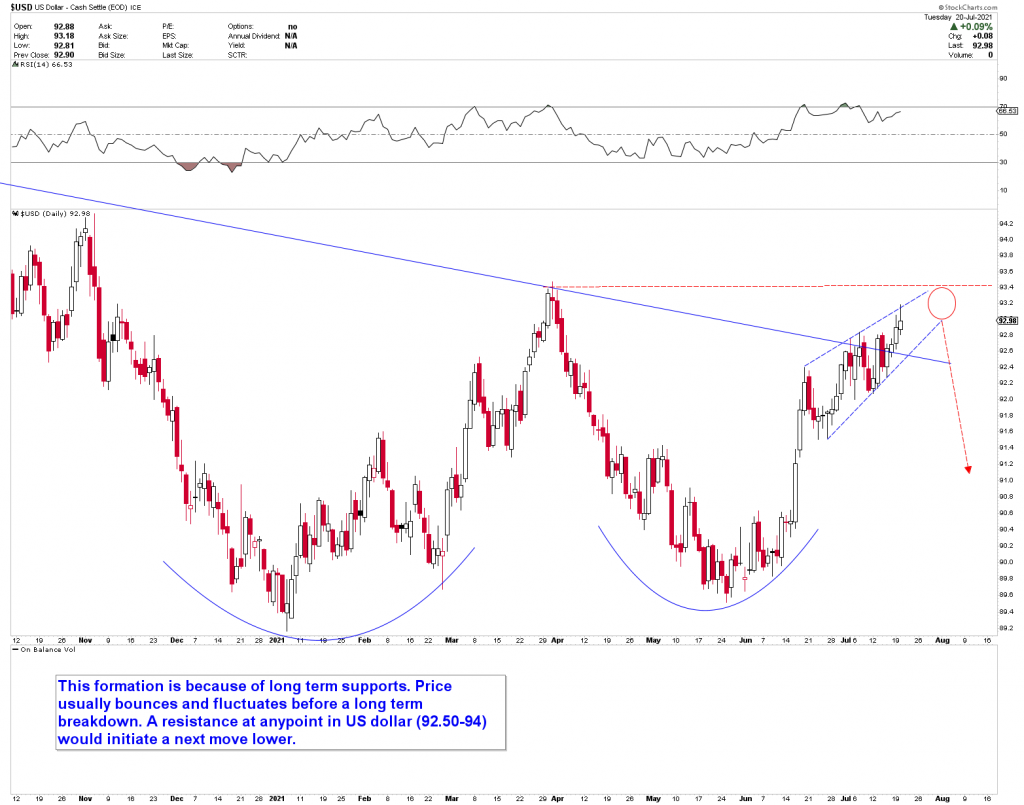
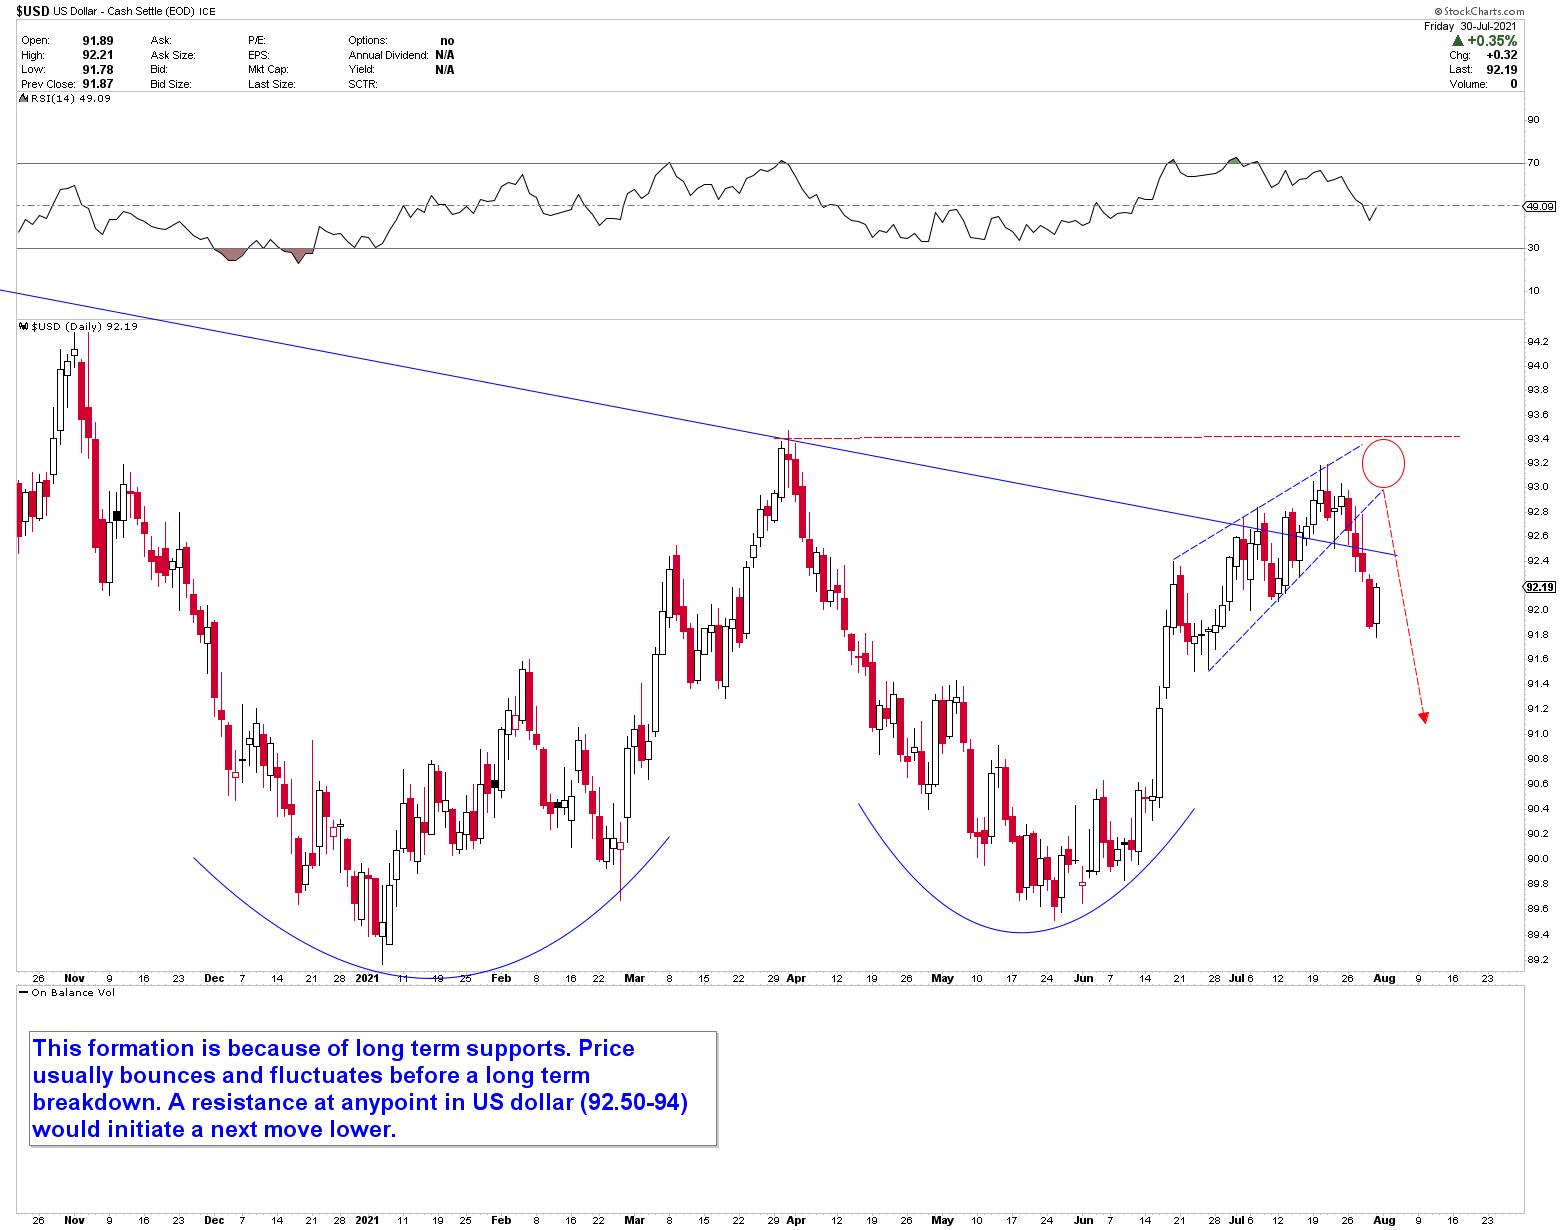
Let's take a look at the daily chart of the US dollar index, which was presented last week. We have publicly stated that the US dollar index is likely to fall from the red circle because we expect this sideways range to last for some time. The next chart depicts the resistance's reaction as the US dollar falls.
EURUSD Reaction As US Dollar Weakness
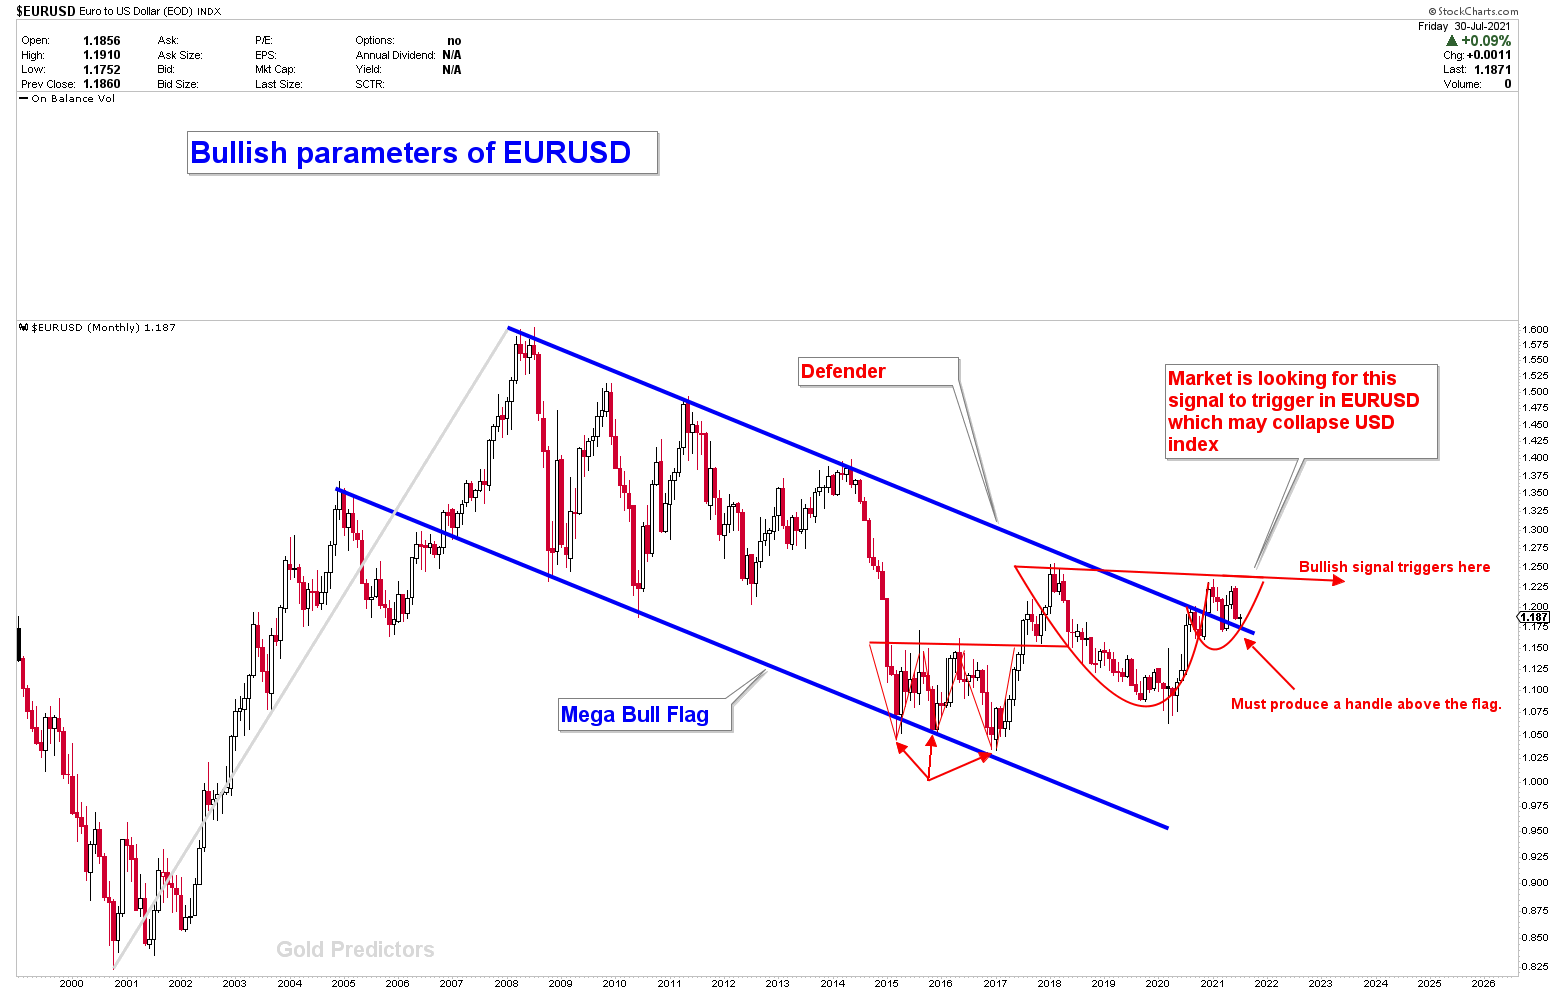
Based on the above discussion, it is clear that the US dollar presents a strongly bearish long-term outlook. The EURUSD currency pair is inversely proportional to the US dollar index. Since the US dollar is exhibiting a strongly bearish view, the EURUSD has developed strong bullish patterns, indicating that the EURUSD must rise in the medium to long term. Let's begin our discussion of the EURUSD by looking at the monthly chart below.
The monthly EURUSD chart shows that the pair has broken the long-term mega bull flag and is now trading sideways in the upper breakout region. The triple bottom support at the mega bull flag was used to form the bottom of the EURUSD. Following the triple bottom, the pair formed a cup and handle, which supports a bullish view. The current sideways market in EURUSD is caused by the sideways region of the US dollar index, and if the US dollar index breaks lower, this pair will have a significant advantage in moving higher. The true bullish signal would be triggered after the Cup and Handle neckline is broken. Since the US dollar forecast is bearish, EURUSD developed strong bullish patterns to support the US dollar view.
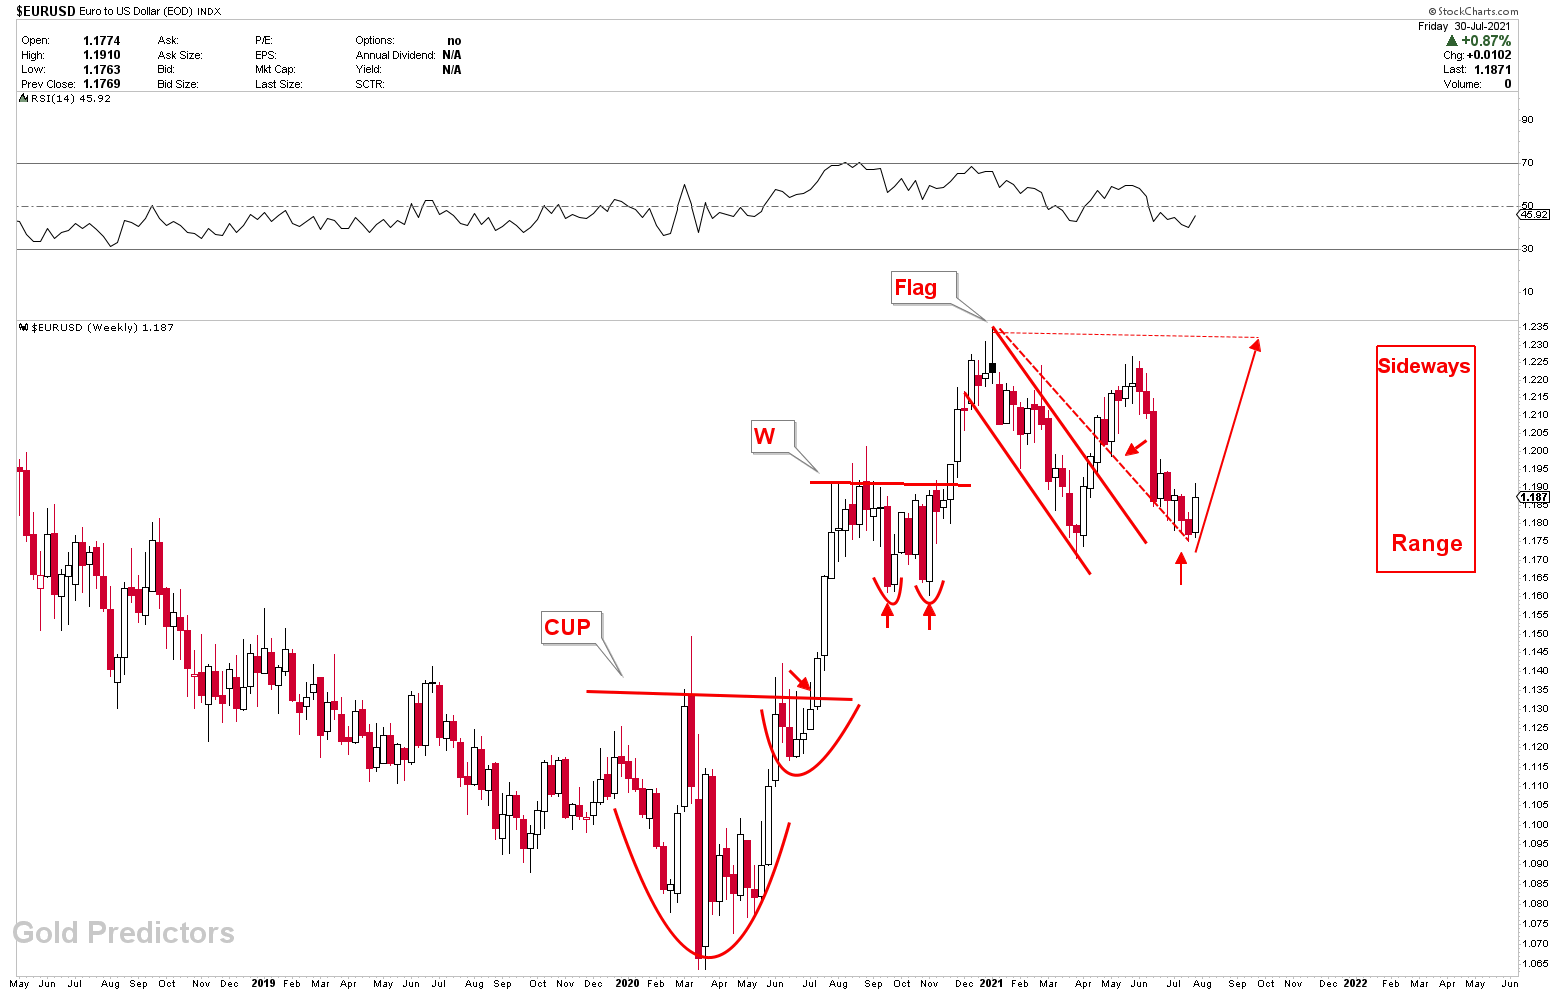
Let's look at the patterns on the weekly EURUSD chart to see how the pair is moving in stages. The first stage involved the breakout of CUP and handle patterns, which was followed by the second stage of W patterns. It is currently testing the flag line of the flag patterns, which provided a strong buying signal for position traders last week. Overall, there is a large sideways range of 1.17 to 1.23 with the range in the US dollar index.
USDCAD Bearish Outlook
Another correlated pair of US dollar index is USDCAD which has produced the bearish view on long term basis. We presented the chart on 5th May and marked a circle to identify a bounce. The old charts are presented below.
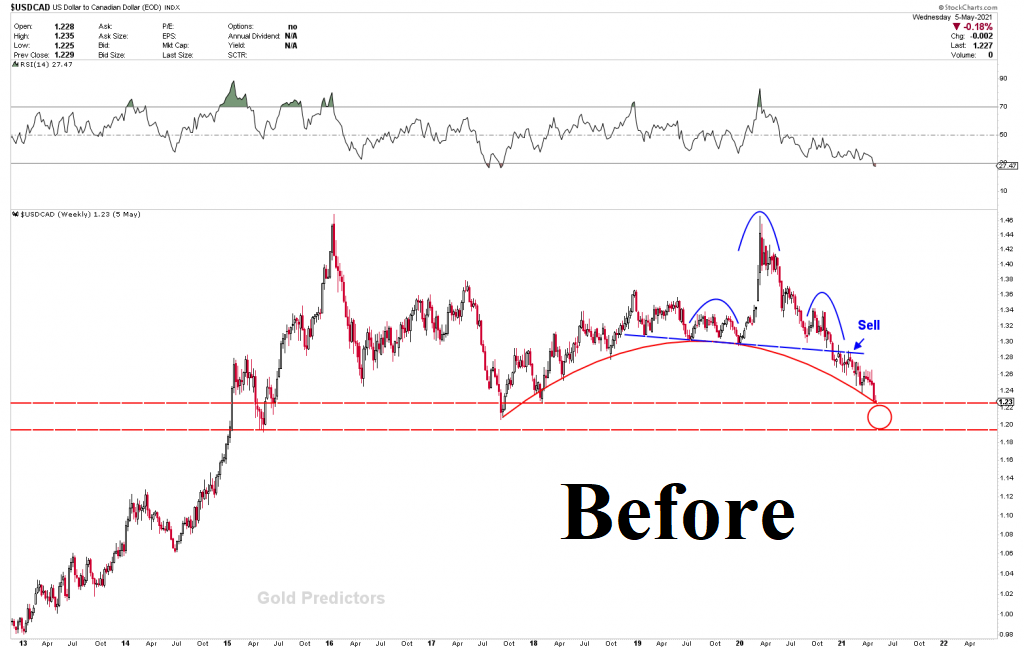
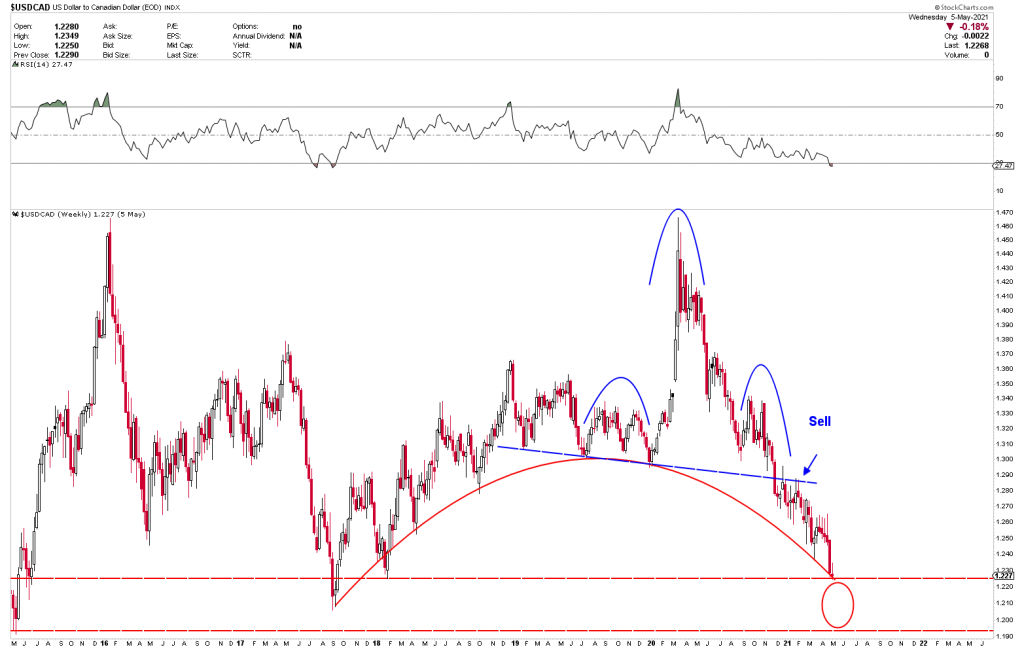
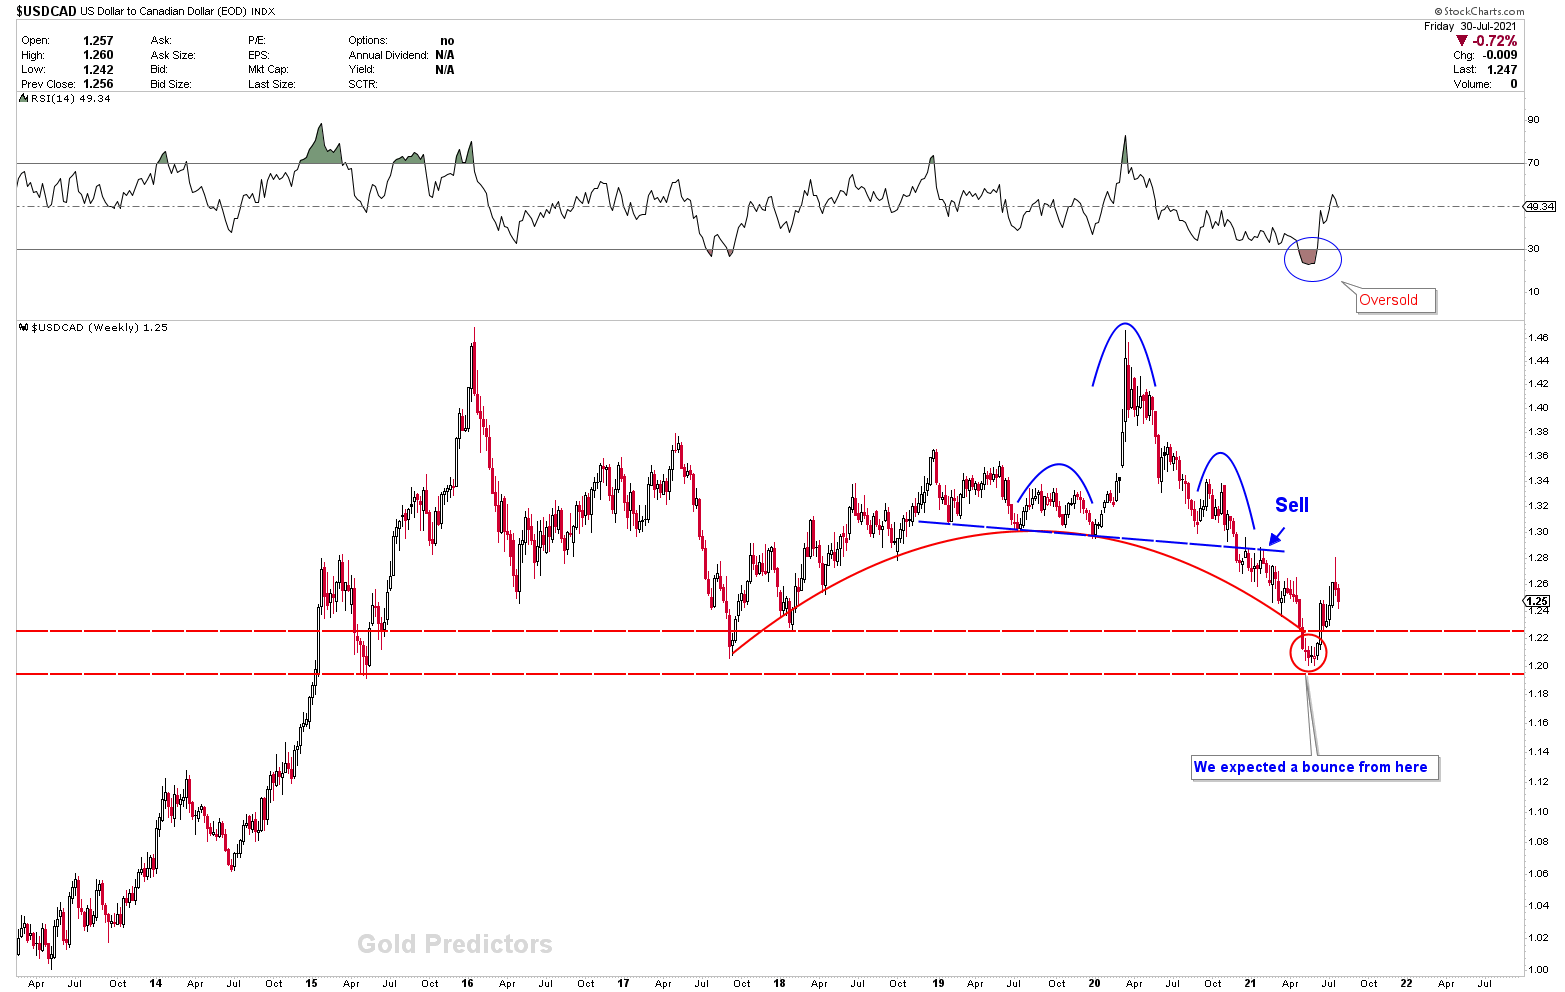
The expected scenario develops and the strong bounce from the circle to around 700 pips hits the first resistance on the chart. The primary patterns remain downside and the instrument is inclined to fall further. A break of this circle would be when the US dollar index breaks in long term support juncture and this breakout would initiate a waterfall in the pair.
USDJPY Response to US dollar Weakness
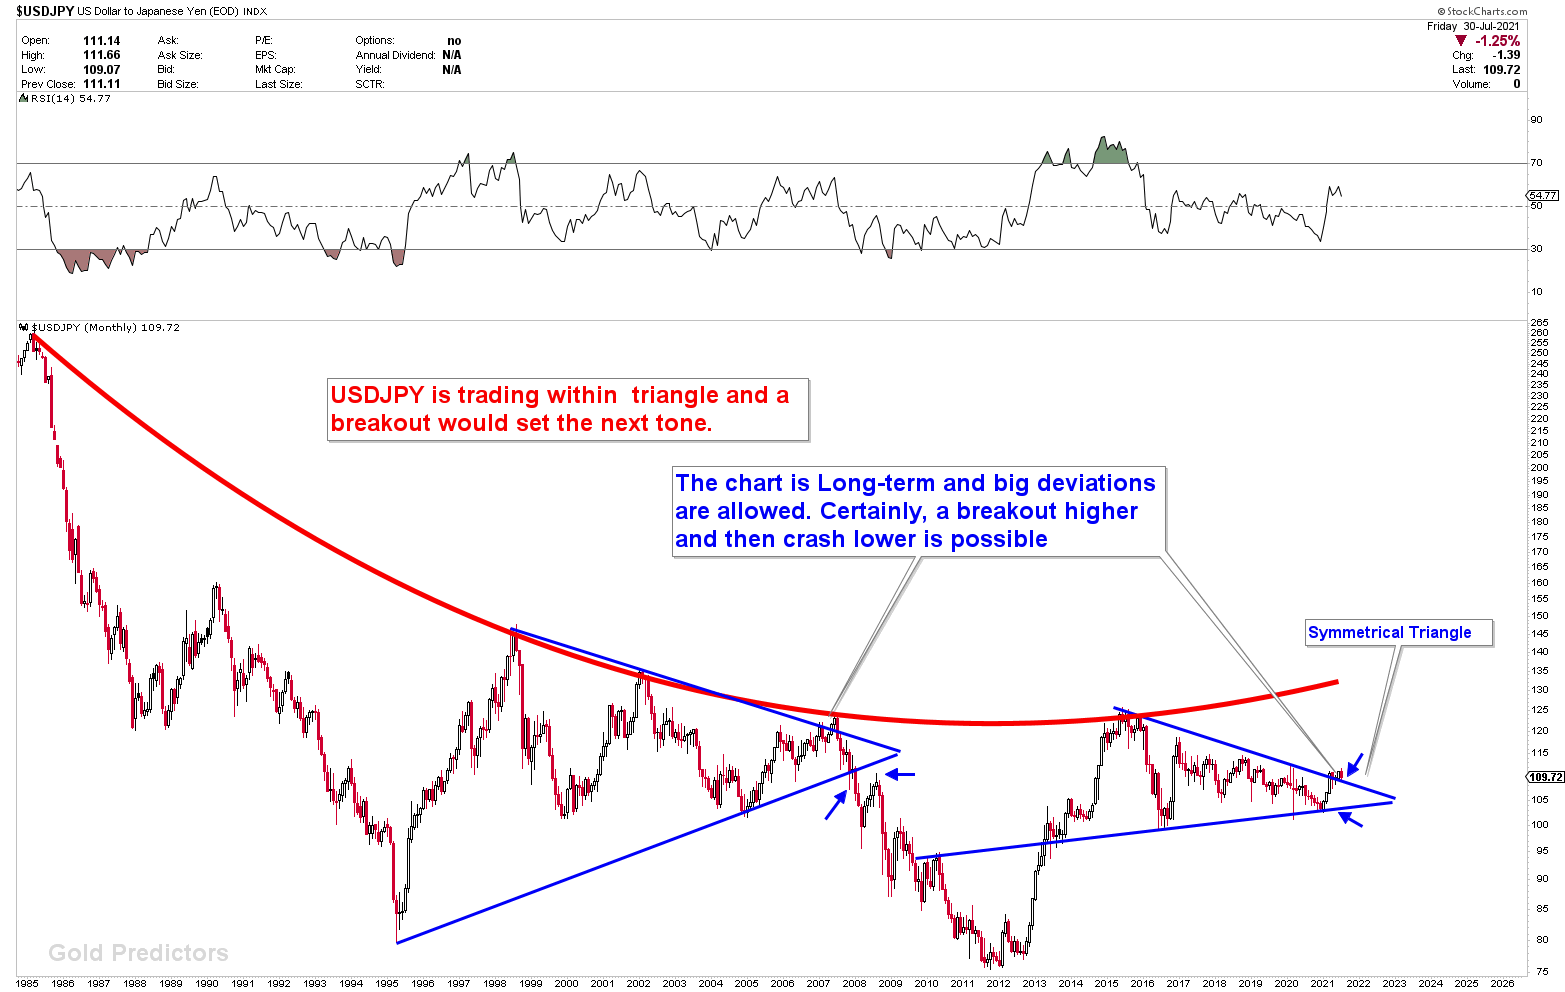
For a long time, we have been strongly bearish on the USDJPY. Let's take a look at the USDJPY monthly chart, which shows a red falling curve in the same fashion as the US dollar index. The USDJPY's symmetrical triangle is identical to the one formed between 1995 and 2007. A break through of this symmetrical triangle is a significant move. Because the patterns are long-term, large deviations are allowed on both sides. In 2007-2008, the USDJPY produced a false breakout and then reversed lower. A false breakout in June/July 2021 may initiate the next move lower in the instrument in 2021.
Final Words
According to the discussion above, the US dollar hit a strong resistance in 2020 at the red arc resistance. A sharp reversal candle of 2020 within the 16-year cycle top indicates that the US dollar will continue to fall. The monthly chart shows that the US dollar is rising due to strong long-term support. The current rise in the value of the US dollar was expected. The bounce quality is churny and choppy, implying a weakness.
The US dollar is weakening in correlated pairs such as EURUSD, USDCAD, and USDJPY, which supports the analysis of the US dollar index. Because the US dollar is expected to fall, these pairs must follow the US dollar's lead. The current wide ranges in major US dollar correlated markets are due to the US dollar testing long term support levels. If the US dollar falls below 89, major forex and commodity markets must offer good trading opportunities.


Comments
Log in or sign up to join the conversation.