
T2108 Update – Caution Emerges As The Trump Rally Leans On The Santa Claus Effect For Rest
The market’s enthusiasm has notably waned going into Christmas. A consolidation pattern has emerged for the S&P 500 (SPY) that further tempers my expectations for the seasonal “Santa Claus rally.”
The first half of December, defined by me as the first 10 trading days, delivered a gain of 2.5%. This gain was reduced by the post-Fed selling that dropped T2108 from overbought status. The Santa Claus rally, defined by me as the remaining trading days of December, have so far failed to recover the modest post-Fed loss while producing a meager 0.5% gain. I analyzed the numbers for the Santa Claus rally two years ago and found a strong tendency for the second half of December to deliver a gain for the S&P 500 no matter how the first half performs. So, I continue to expect a benign trading environment going into the end of the year.
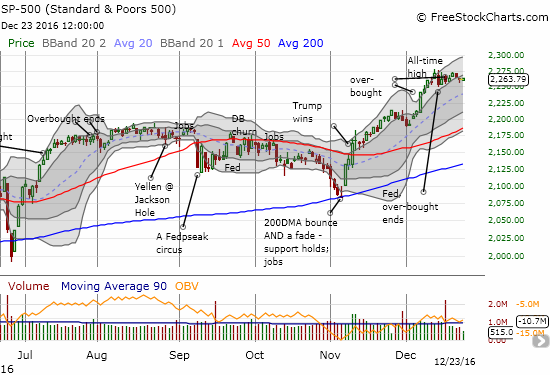
The S&P 500 continued its post-Fed consolidation heading into Christmas.
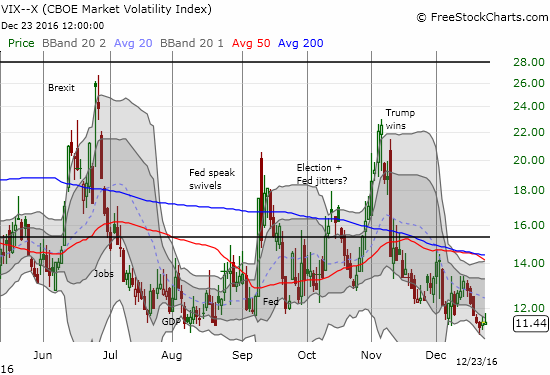
Meanwhile the yawning complacency in the volatility index, the VIX, underlines the benign nature of Santa Claus trading.
The slow deterioration in T2108, the percentage of stocks trading above their 40-day moving averages (DMAs), belies this otherwise benign consolidation period. In my last T2108 Update, I described how my favorite indicator made a feeble return to overbought status. Its struggles over the past two trading days to cling onto that overbought status seem to validate my assessment.
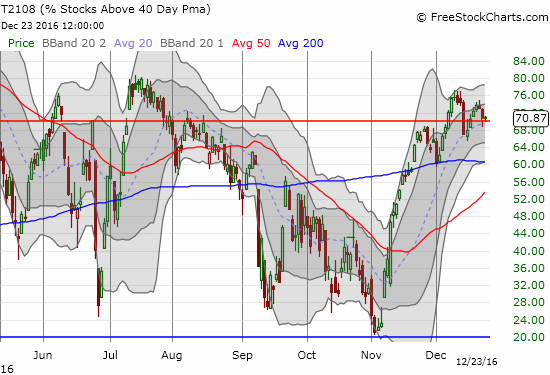
Over the last two trading days, T2108 has dropped below overbought conditions but managed to cling to the threshold by the close.
Given this struggle, my eyes are more tuned for signs that confirm market weakness even as I maintain a neutral short-term trading stance. Top of my “worry list” are SPDR S&P Retail ETF (XRT) and the Australian dollar (FXA) trading versus the Japanese yen (FXY).
XRT sold off dramatically this week in the wake of data on personal incomes and spending. The selling cracked 50DMA support and continued a trend of near persistent selling since the S&P 500 convincingly broke out on December 7th. XRT now looks ready to finish reversing all its post-election gains during the biggest retail period of the year.
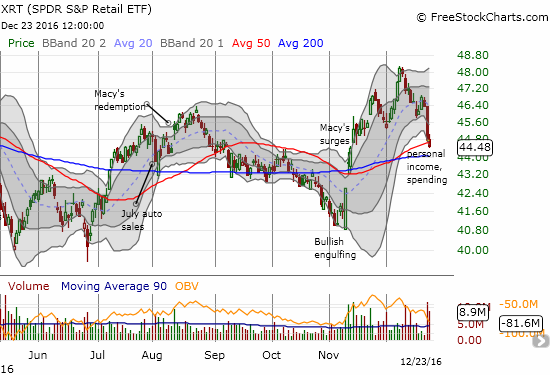
The latest weakness in SPDR S&P Retail ETF sticks out like a sore thumb in an otherwise benign trading environment.
The Australian dollar notably weakened after the Federal Reserve hiked interest rates. Sellers have turned on the commodity-driven currency enough to send AUD/JPY hurtling downward from its last high – that high just happened to finally bring AUD/JPY back to even for the year. Support at the 50DMA is now in play. I am guessing a significant pullback, perhaps even a crash, is around the corner for iron ore, Australia’s most important export.
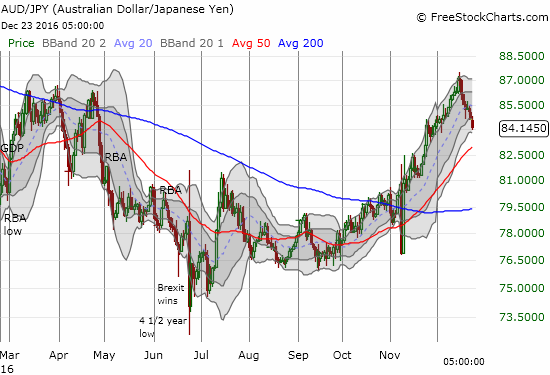
The impressive run-up in AUD/JPY has come to a dramatic end.
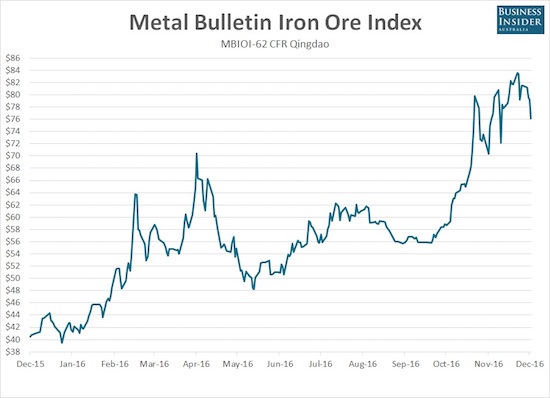
Source: Business Insider
Iron ore has enjoyed a tremendous recovery in 2016 and even powered its way through recent strength in the U.S. dollar index. Yet, volatility has surged in the past few months with wild swings up and down through highs for the year – likely signs of a top in the making.
As a reminder, I think of AUD/JPY as a close proxy for the market’s attitude toward risk. So, the strong rally since the election served as convincing confirmation of the market’s renewed bullish fervor. The sell-off since the Fed’s rate hike now serves as convincing confirmation that this fervor has lost steam. AUD/JPY will play prominently in my next decision to flip the short-term trading bias off its neutral stance.
I continue to monitor Financial Select Sector SPDR ETF (XLF) as well of course. Like the S&P 500, XLF has gone into consolidation mode since the Fed. I cannot imagine getting bullish during this overbought period without XLF breaking out of this consolidation to the upside.
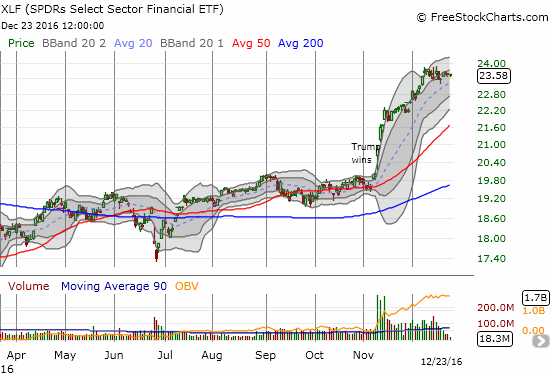
Financial Select Sector SPDR ETF is taking a rest from eye-popping post-election gains.
I conclude with an overdue requiem for my Telsa (TSLA) versus Solar City (SCTY) pairs trade. I first proposed this trade in early September. After mixed results, I dug in my heels with positions expiring this month. This position turned out to be one of the worst pairs trades I have put in place in a very long time. Both sides, the TSLA call spread and the SCTY put spread, expired completely worthless whereas I am usually able to salvage one side of the trade when things do not work out as hoped. TSLA shareholders approved the merger with SCTY with nary a protest. The whole event became anti-climactic.
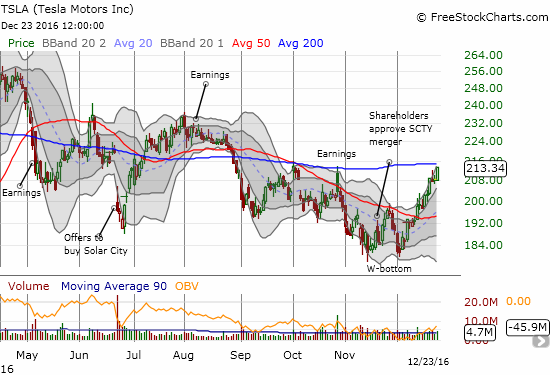
The technicals on Tesla suggest a W-bottom is in place, but the stock needs to break through resistance at its 200DMA to confirm.
TSLA is up 12.6% for the month and is up a whopping 17.6% from a retest of the last lows. This impressive move carved out a W-bottom that is on the edge of confirmation. I fully plan to play TSLA in the coming days or weeks based on its behavior around its critical 200DMA.
Daily T2108 vs the S&P 500

Black line: T2108 (measured on the right); Green line: S&P 500 (for comparative purposes)
Red line: T2108 Overbought (70%); Blue line: T2108 Oversold (20%)
Weekly T2108

All charts created using freestockcharts.com unless otherwise stated
The charts above are the my LATEST updates independent of the date of this given T2108 post. For my latest T2108 post click here.
(T2108 measures the percentage of stocks trading above their respective 40-day moving averages [DMAs]. It helps to identify extremes in market sentiment that are likely to reverse. To learn more about it, see my T2108 Resource Page. You can follow real-time T2108 commentary on twitter using the #T2108 hashtag. T2108-related trades and other trades are occasionally posted on twitter using the #120trade hashtag. T2107 measures the percentage of stocks trading above their respective 200DMAs)
T2108 Status: 70.9%
T2107 Status: 64.6%
VIX Status: 11.4
General (Short-term) Trading Call: neutral
Active T2108 periods: Day #213 over 20%, Day #33 over 30%, Day #32 over 40%, Day #30 over 50%, Day #24 over 60%, Day #6 over 70% (overbought)
Related links:
The T2108 Resource Page
Disclosure: mixed positions on the U.S. dollar, long SDS, short AUD/JPY.
more


40 dma--my line in the sand sitting on my hands..ra! good article!
Definitely a good line in the sand! :)
Very true, and thanks for a great article.