
S&P 500, Nasdaq Talking Points:
- This afternoon brought a 3rd consecutive 75 bp rate hike from the Fed along with assurances of more to come.
- Unlike Powell’s Jackson Hole speech, the commentary was not short and to the point and there were a number of drivers for both bulls and bears to chew on. The key response has shown after the close of the presser, and this puts emphasis on the next couple of days of price action to gauge market response. Of note, there’s a Bank of Japan rate decision tonight and a Bank of England rate decision tomorrow morning.
We’re on the other side of the September FOMC rate decision and frankly, there are more questions than answers at this point. But, there’s some evidence supporting that observation and that’s the fact that stocks were still holding within previously defined ranges until after the finish of the presser. There’s been a delayed risk-off response with stocks pushing back to session lows. I’ll look at equities in greater depth, but a few key markets need to be addressed first.
While Powell offered some comments that can be construed as dovish or bullish for stocks, the overriding message is that the Fed is hiking until inflation is back under control. It was the addition of the word ‘pain’ that Powell had inserted towards the end of the presser that seemed to catch so many traders’ attention.
US Rates
This is probably the most noticeable impact from the initial statement release: The two-year note jumped above 4% and ran to a fresh 15-year high of 4.12%. That didn’t hold for long, however, as prices quickly dipped back below the 4% marker during Powell’s speech.
The latter portion of that speech saw Powell with some relatively-hawkish comments, discussing the possibility of ‘pain’ in the economy as the Fed continues hiking rates, and pushed yields back up with the two-year currently trading at 4.02% as of this writing.
US Two-year Notes
(Click on image to enlarge)

Chart prepared by James Stanley
US Dollar
The US Dollar is often most responsive to short-term rates, so something like the yield curve getting more and more inverted could be a positive factor for the US Dollar. The USD was very bullish earlier in the day, posing breakouts from ascending triangles at 110.24 yesterday and then above the 110.79 level in today’s session.
Like US rates, the USD caught a quick shot of strength around the release of the statement which helped the greenback to rush up to a fresh 20-year-high of 111.58.
Prices are already pushing back up towards that high in a continuation move but this will remain an item of interest through the end of the week.
US Dollar Two-hour Price Chart
(Click on image to enlarge)
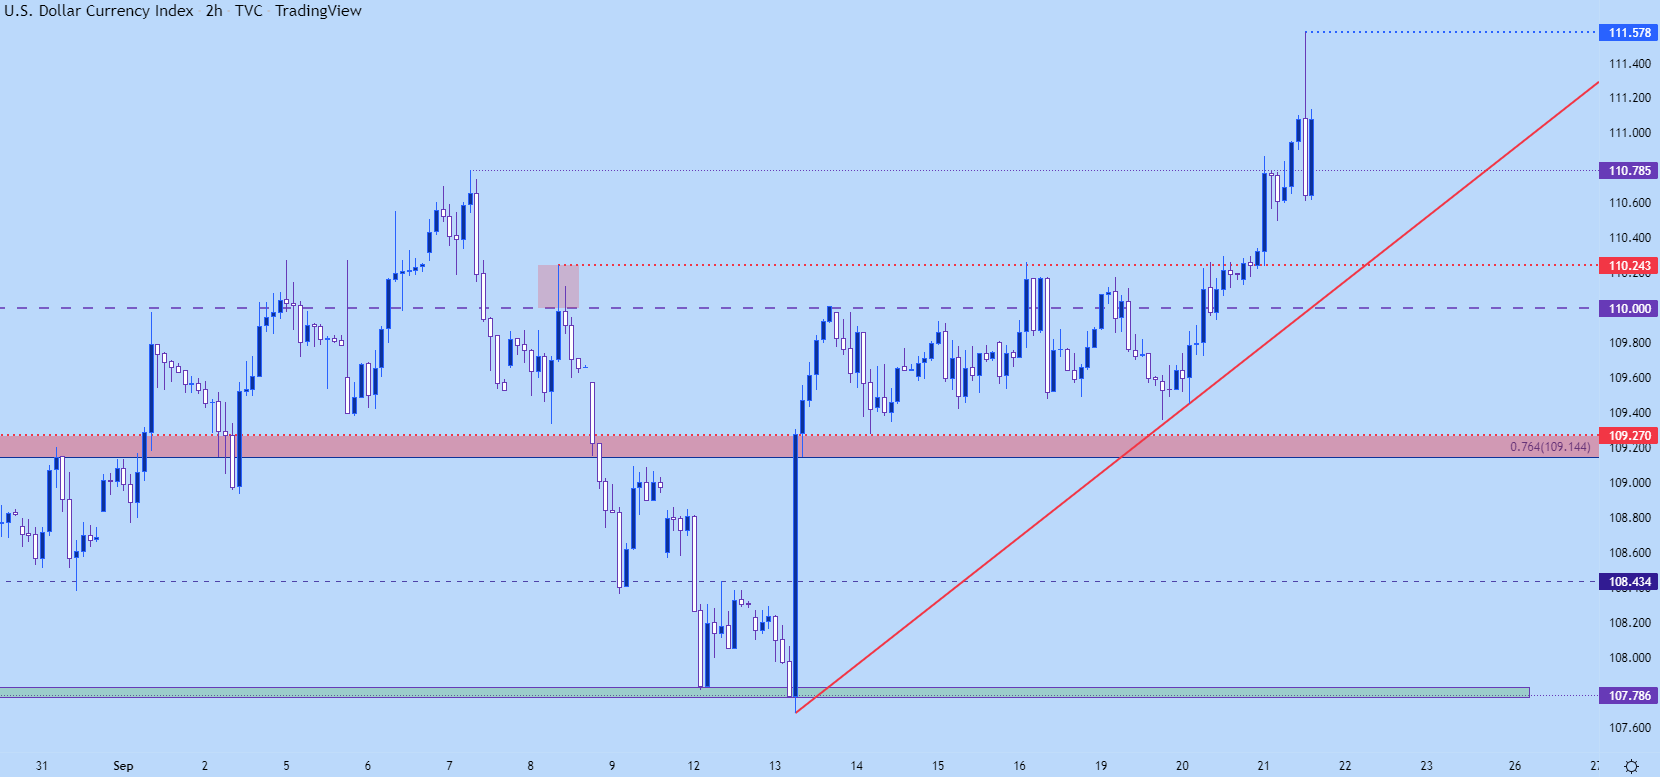
Chart prepared by James Stanley; USD, DXY on Tradingview
EUR/USD
I had warned that EUR/USD support was looking vulnerable earlier in the day, and that was an extension of what I had discussed yesterday.
EUR/USD dipped down for a fresh 19-year-low and is now grasping for the swing-low from earlier in September, which runs from around .9862-.9876, which also invalidates the falling wedge, which was keeping the door open for bullish reversal scenarios. This puts the focus for EUR/USD back on the bearish side of the coin – and there’s resistance potential at prior support of .9950 and again at parity if bulls can muster a deeper pullback.
EUR/USD Daily Price Chart
(Click on image to enlarge)
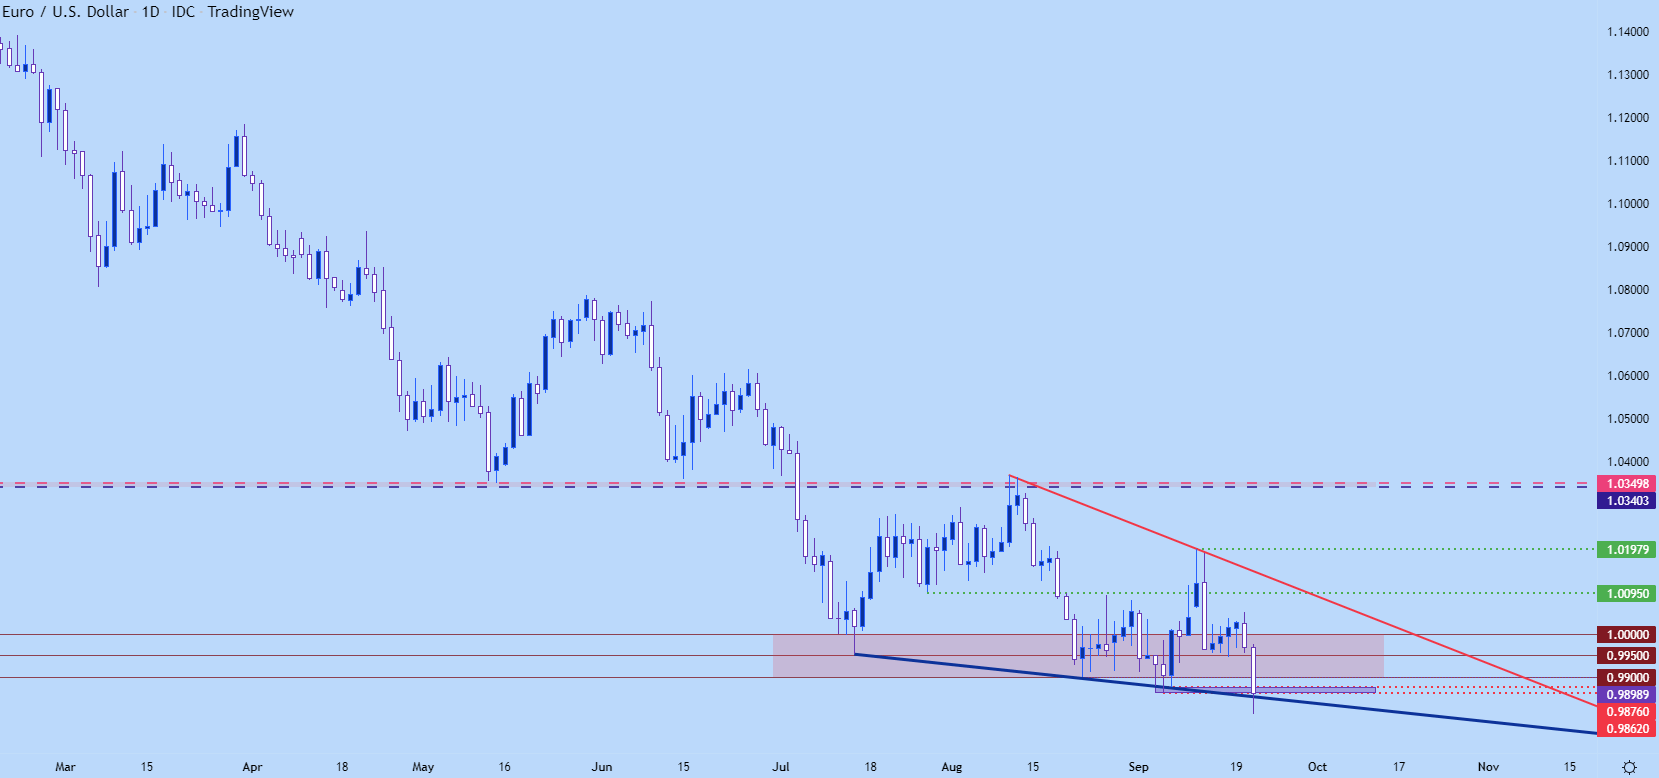
Chart prepared by James Stanley; EURUSD on Tradingview
S&P 500
Stocks had an initially bullish response to Powell’s presser, particularly to the familiar line of ‘it may be appropriate to slow the pace of rate increases,’ which is read to be extremely dovish. Powell later buffered that line by talking about ‘pain’ and the fact that the Fed will persistently be targeting rates until inflation shows a more-convincing fall.
I had discussed this yesterday and a key zone of resistance came into play today, plotted from the 3902-3915 Fibonacci levels. This helped to mark the session high during the press conference before bears went in for the fresh low.
S&P 500 5-Minute Chart
(Click on image to enlarge)
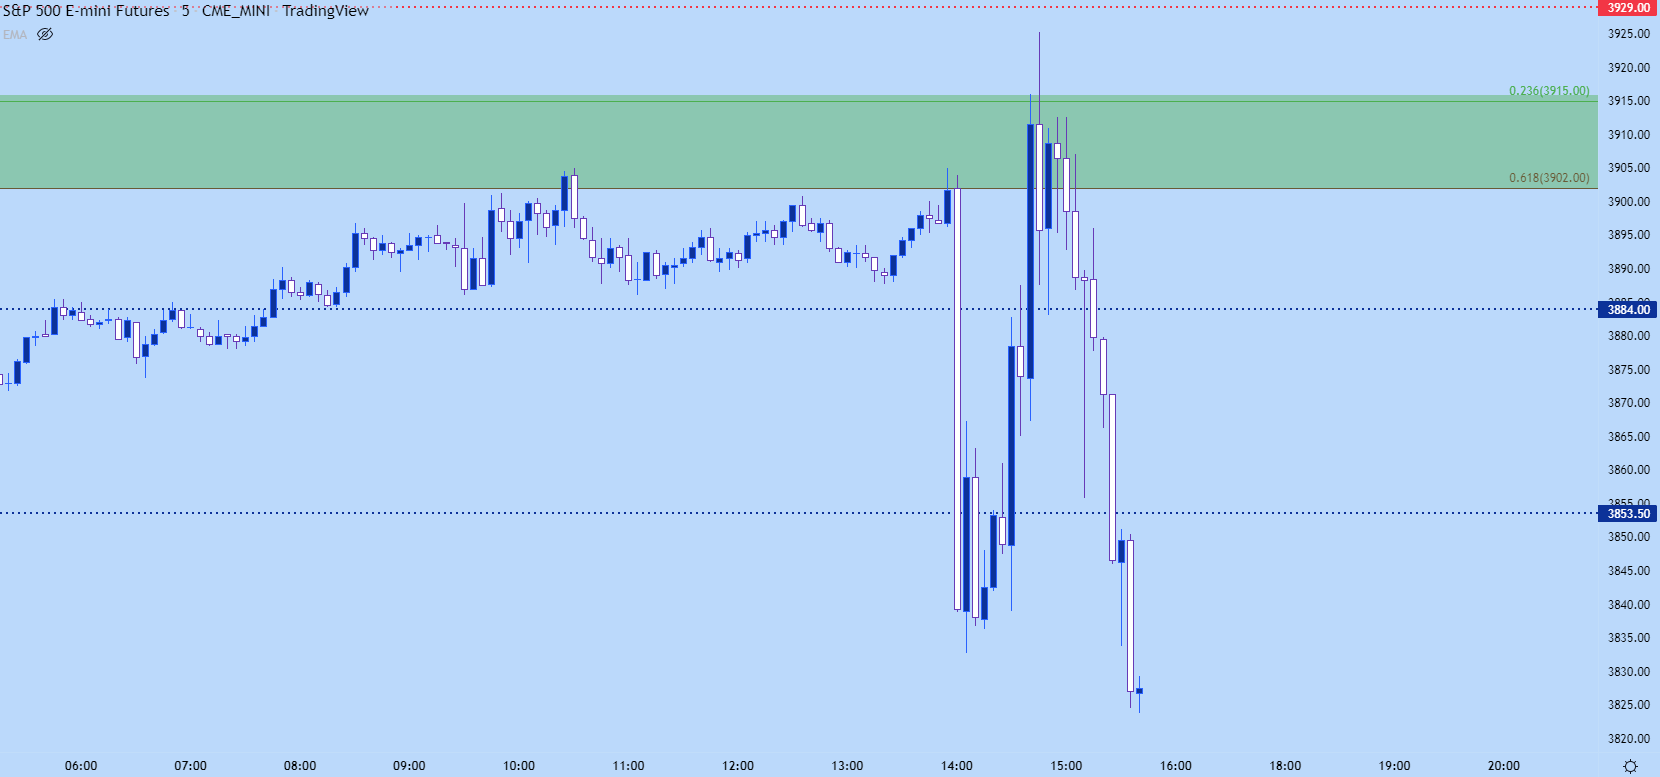
Chart prepared by James Stanley; S&P 500 on Tradingview
S&P 500 Longer-term
Taking a step back, we now have fresh two-month-lows on the S&P 500 and there’s a major zone of support nearing that runs from 3786-3802. Below that, there’s another spot of price action support around 3750 and after that, the June lows come into focus at 3639.
S&P 500 Daily Chart
(Click on image to enlarge)
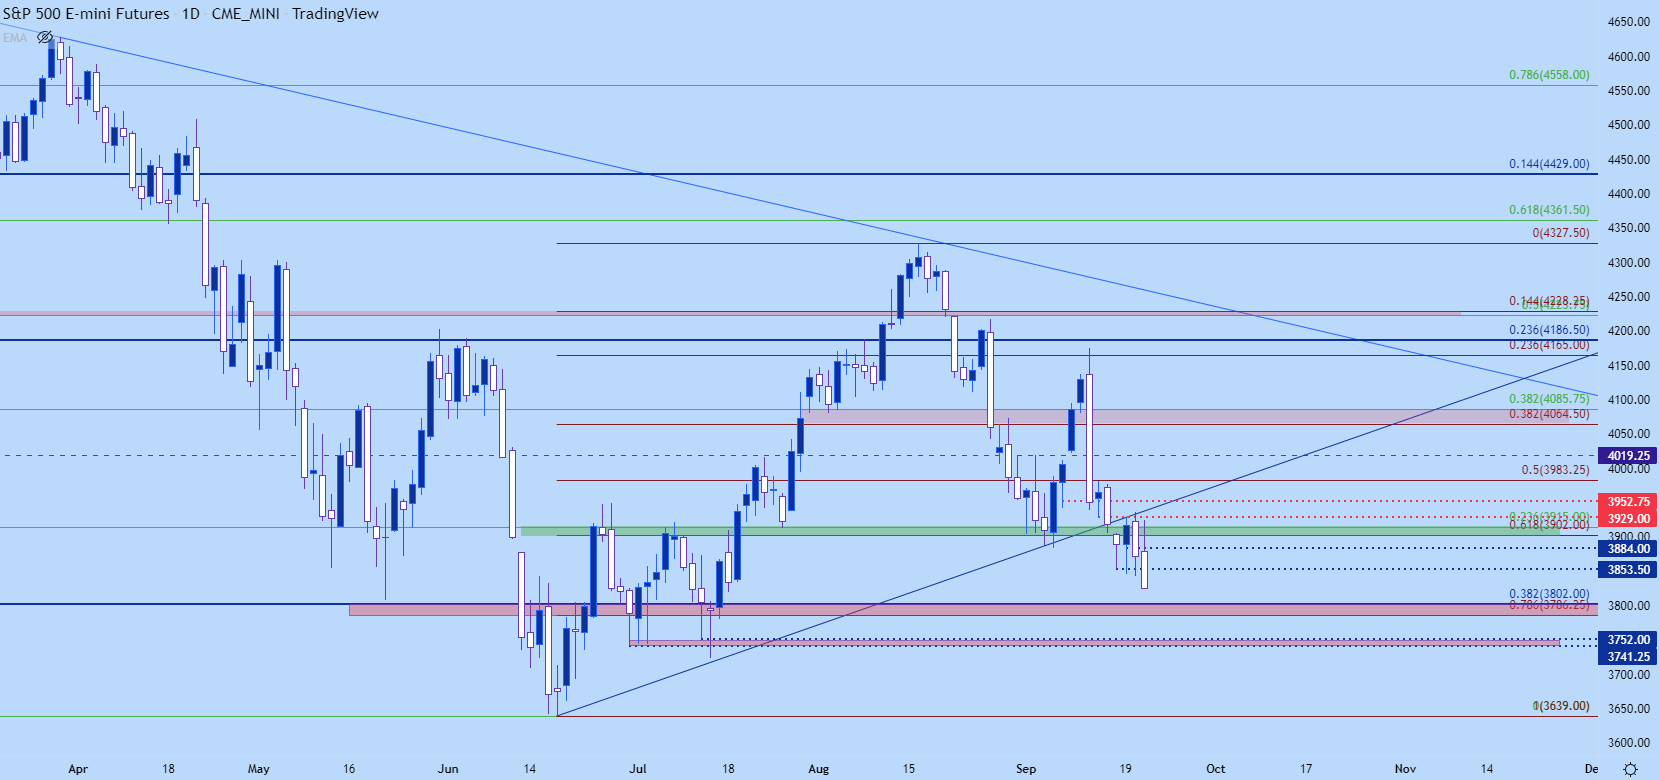
Chart prepared by James Stanley; S&P 500 on Tradingview
Nasdaq
The Nasdaq’s move looks a bit more subdued to me and interestingly, the tech-heavy index did not set a fresh lower-low over the past two days while the S&P 500 did.
The fresh low is coming in now, however, in the wake of FOMC and prices are now at fresh two-month-lows there. My next support is fast approaching around 11,700, after which the two-year-low comes into play in the zone running from 11,069-11,294.
Nasdaq Daily Price Chart
(Click on image to enlarge)
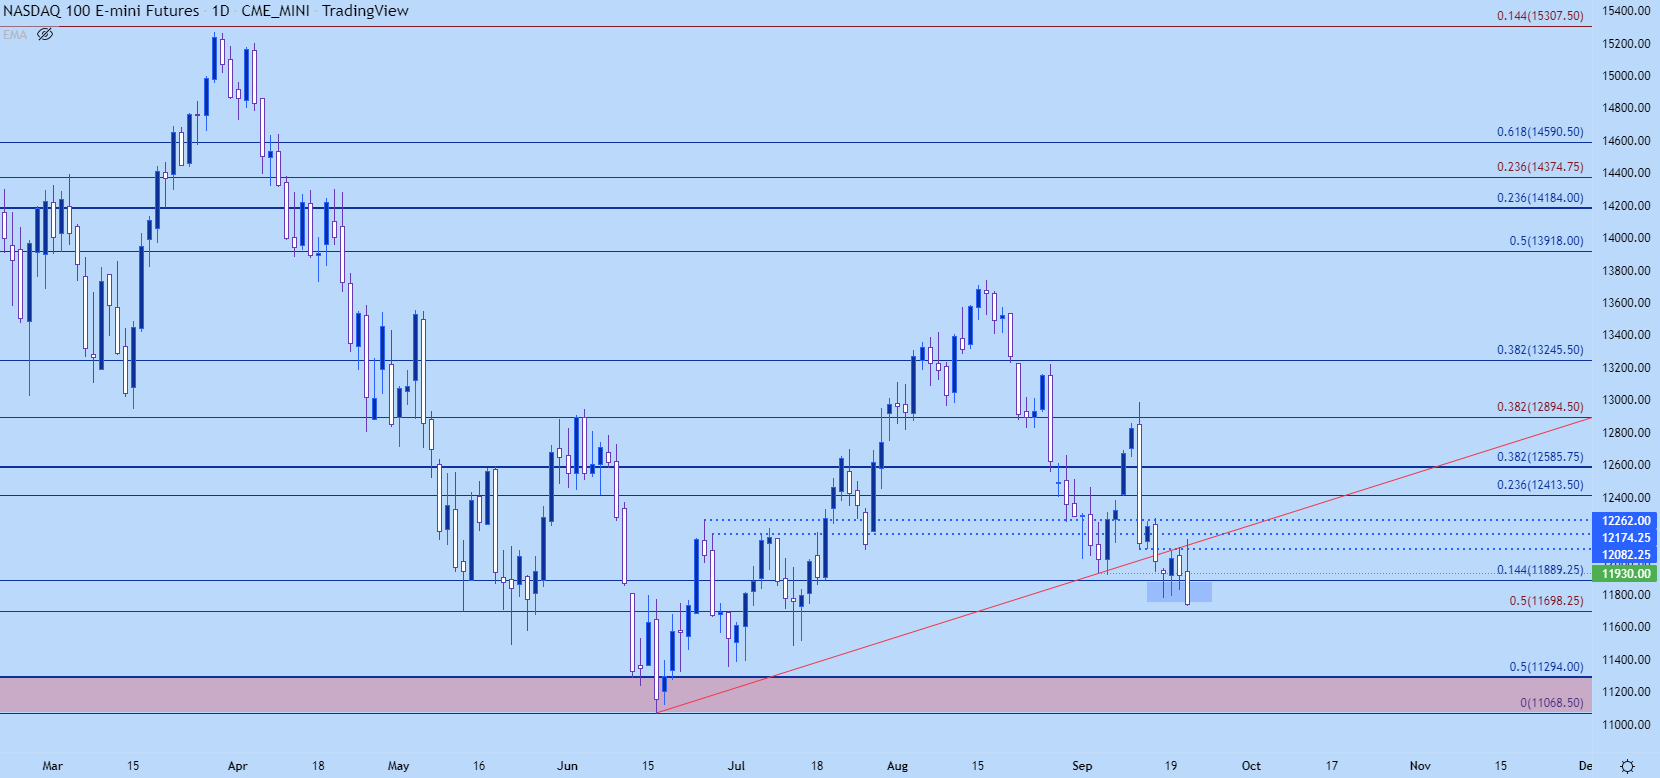
Chart prepared by James Stanley; Nasdaq 100 on Tradingview
More By This Author:
Fed Hikes Rates By 75 bp To Curb Inflation; What’s Next For S&P 500, USD & Bitcoin?Euro Wilts Again As Putin Ups Ante, Forcing Focus From Fed
Breaking News: Mobilization Declaration By President Putin Spooks Markets, Risk Off


Comments
Log in or sign up to join the conversation.