Making Sense (If Possible) Of Expected Inflation And The Dollar

Image Source: Pexels
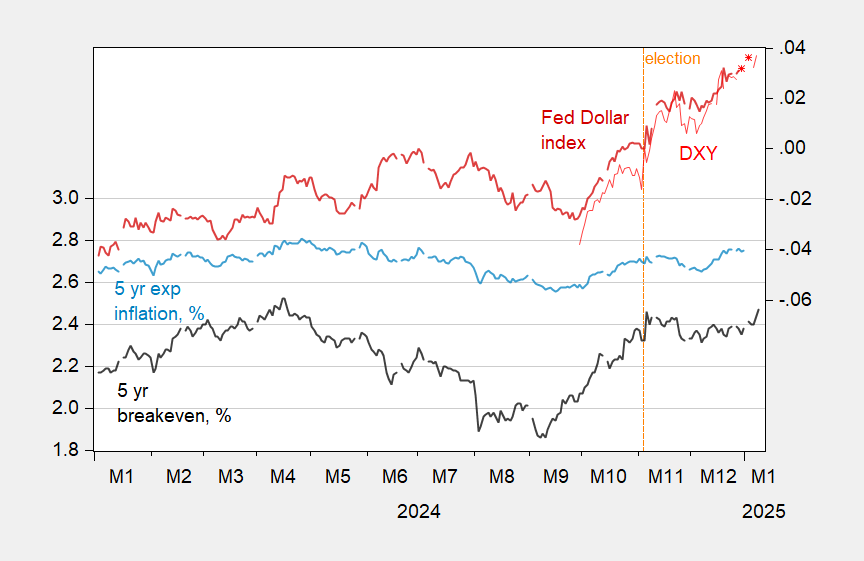
Five year breakeven up, dollar up.
Figure 1: Five year Treasury breakeven (black, left scale), 5 year expected inflation (light blue, left scale), both %; nominal trade weighted dollar index (dark red, right scale), and DXY (red), both in logs, rescaled to 11/5/2024 = 0. Source: Treasury and Fed via FRED, Fed (KWW), investing.com.
Since the 5-year breakeven incorporates a risk premium, it’s not a reliable indicator of inflation expectations. Kim, Walsh and Wei following D’Amico, Kim, and Wei (2018) provide estimates of expected inflation purging of risk and liquidity premia. Expected inflation has risen about 5 bps since the election (thru 12/31/2024) while the breakeven has risen by about the same. That suggests that through today (1/8/2025), expected inflation has risen by about 15 bps, presumably as the prospect of faster inflation due to fiscal blowout, tariffs and deportations becomes more solid to markets.
The continued appreciation of the dollar — 3.7% since the election alone — then makes sense with higher real rates (14 bps increase in 5 year TIPS) anticipated as much more deficit spending is now anticipated, and tariffs depressing anticipated growth in the rest-of-the-world.
More By This Author:
Term Spreads In Advanced Economies One Year Ago, And Conditions TodayRisks, 2025
The Price And Income Elasticities Of US Trade Flows


