

Photo by Dmitry Demidko on Unsplash
Gold Price Outlook
- Gold prices have plunged since mid-August, hurt by broad-based US dollar strength and rising real yields.
- After bouncing off the $1,700 area early last week, XAU/USD appears to be stabilizing.
- This article looks at the key technical levels for XAU/USD to watch over the coming days.
Gold prices (XAU/USD) have begun to show tentative signs of stabilization in recent days following the massive selloff in late August, but the metal remains somewhat vulnerable amid rising interest rates and broad-based US dollar strength in the Forex space.
Since the middle of last month, the US currency, as measured by the DXY index, has been up roughly 3.5%, reaching levels not seen since 2002. During this particular period, real yields, the true gauge of borrowing costs, have also soared, with the 10-year TIPS surging more than 50 basis points to 0.86%, matching June's multi-year high, turbocharged by falling inflation expectations and the central bank's hawkish stance.
Although the current backdrop may prove difficult for gold, the yellow metal may have bottomed out this year. First, the FOMC’s aggressive actions have yet to fully play out in the real economy; after all, monetary policy acts with a long and variable lag. When the slowdown becomes more noticeable in the coming months, which is the baseline scenario, Treasury rates should begin to recede or, at the very least, stop trekking upwards.
With nominal yields likely peaking, their real counterparts may have limited upside going forward, especially in light of recent developments on the inflation front. For context, the 10-year breakeven, a market-derived measure of expected inflation, which stood at 3.02% in April, has resumed its decline, hitting 2.44% earlier this week and approaching its long-term average of 2.40%.
In the current environment, this forward-looking indicator may not have much room fall, preventing real yields from conquering new cycle highs (real yield is defined as nominal yield minus inflation expectations).
US 10-Year TIPS & 10-Year Inflation Breakeven

Source: TradingView
Looking ahead, some of the fundamental stresses affecting non-yielding assets could begin to abate slowly, allowing gold prices to level off and even perk up, especially if recession fears return with a vengeance and trigger turbulence on Wall Street. Gold is considered a safe-haven asset, so it is reasonable to argue that the metal could perform well in times of heightened uncertainty and risk-off sentiment.
Gold Sentiment: Bearish. Data provided by IG. 86% of clients are net long.
Gold Technical Analysis
Gold fell violently from mid-August through early September, but it encountered support at a long-term rising trendline, bouncing off that technical floor and reclaiming the $1700 mark (prices recently at around $1,717). If bulls regain control of the market and rekindle upside momentum, initial resistance appears at the 50-day simple moving average, followed by $1,780. On further strength, the focus shifts to the August high, just a tough below $1,825.
On the flip side, if bears resurfaced and push the XAU/USD lower, support appears around $1700/$1,675. If this area is breached to the downside, selling pressure could pick up pace, paving the way for a move towards $1,615.
Gold Futures Technical Chart

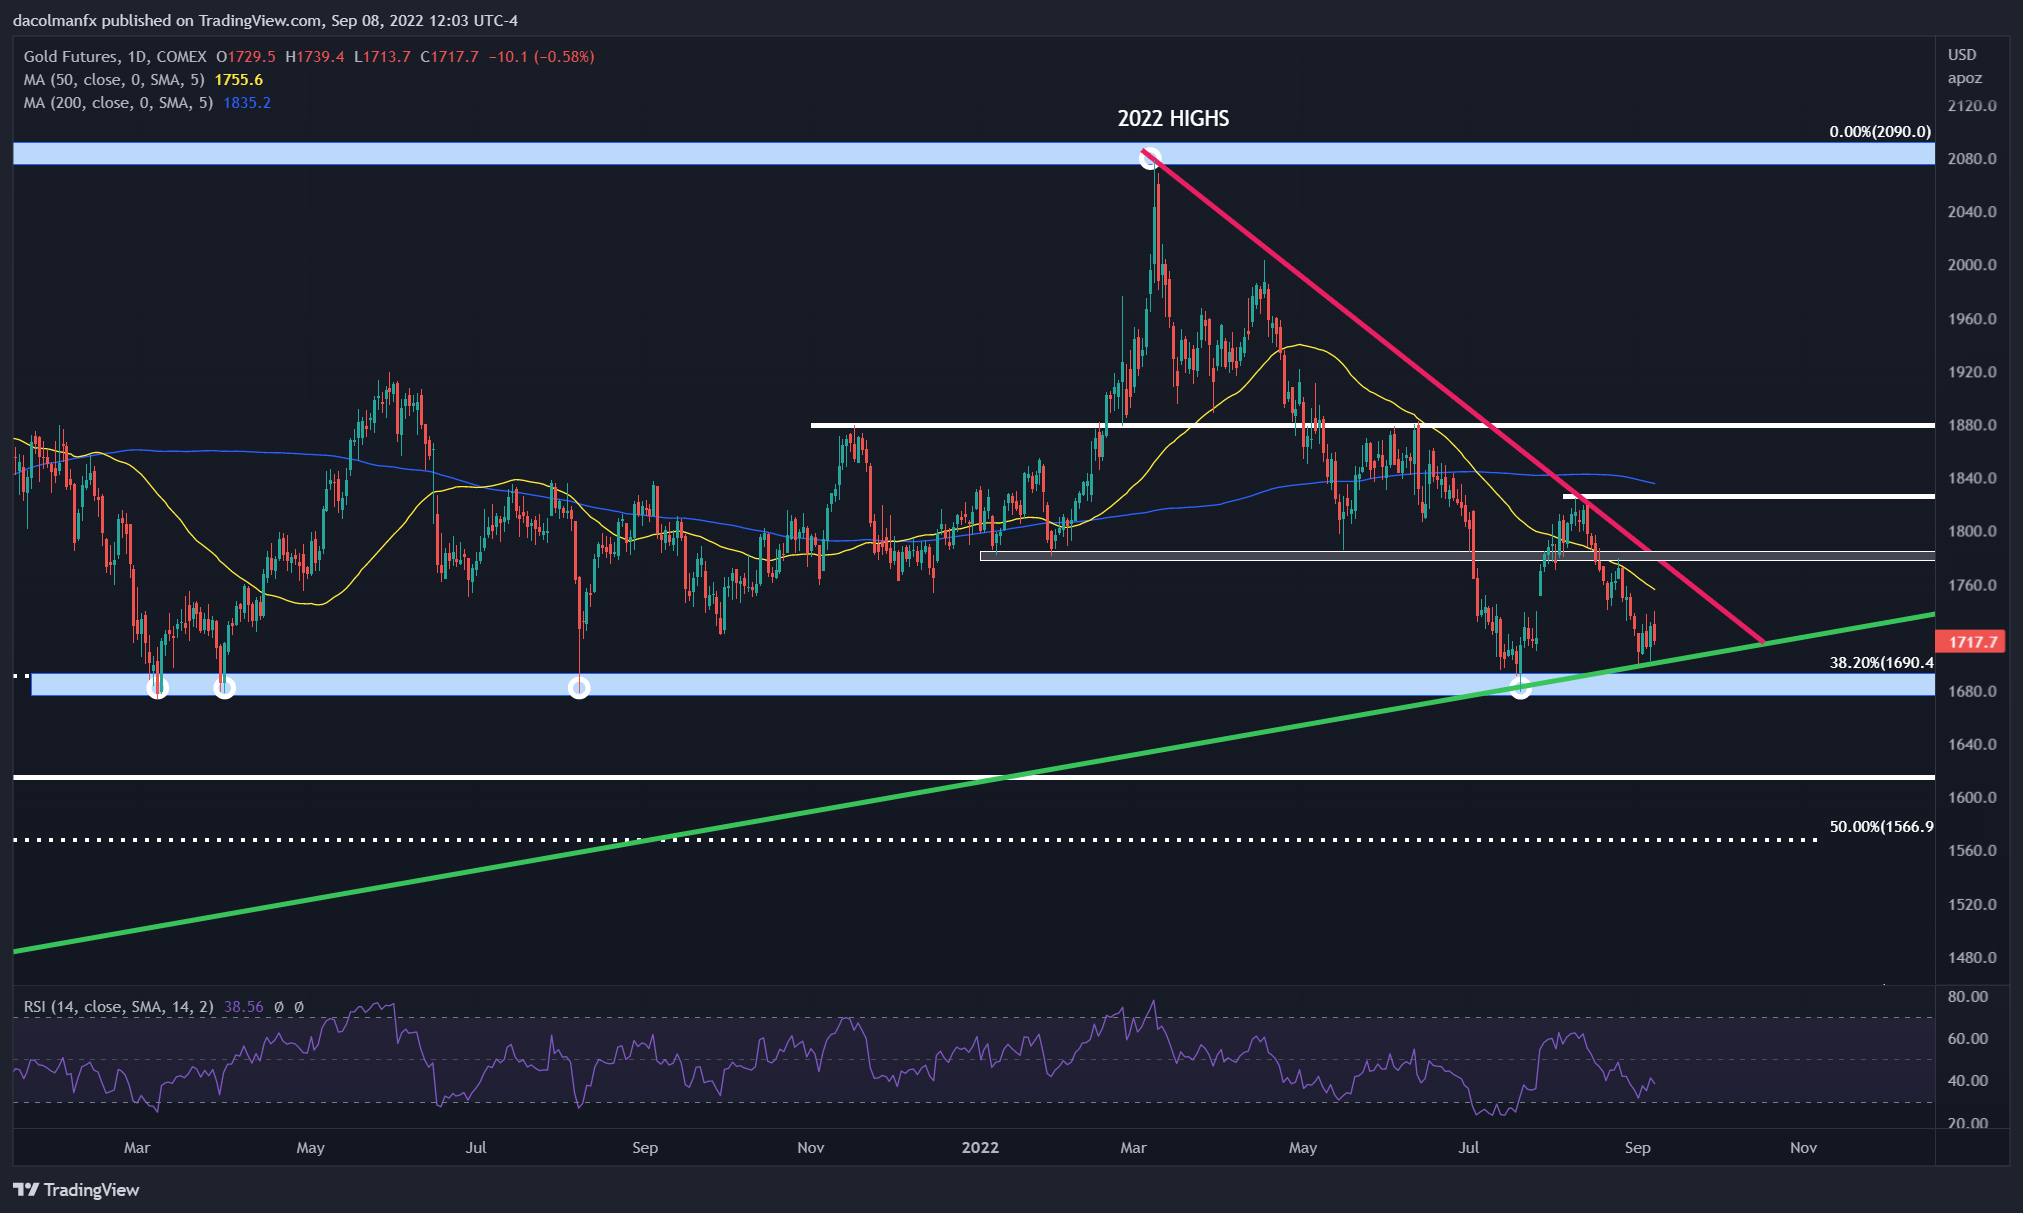
Gold Prices Chart Prepared Using TradingView
More By This Author:
Euro Price Action Analysis Post-ECB: EUR/USD, EUR/JPY
Crude Oil Update: China Lockdowns, Global Rate Hikes Weigh on Oil
Beige Book Confirms Economic Slowdown And Persistent Inflation


Comments
Log in or sign up to join the conversation.