
GBP/USD Mired At Seven-Month Lows Amid Political And Fiscal Concerns

Photo by Philip Veater on Unsplash
The GBP/USD pair declined to 1.3149 on Friday, hovering near a seven-month low. The sell-off was triggered by the government’s abrupt abandonment of plans to raise income tax rates ahead of the Autumn Statement on 26 November.
According to the Financial Times, Prime Minister Keir Starmer and Chancellor Rachel Reeves have scrapped the previously debated increases to basic and higher tax rates. Instead, they will seek more indirect measures to address a budget deficit estimated at £30 billion.
This policy reversal has sparked significant market anxiety over the new cabinet’s fiscal discipline and long-term strategy, leading to a broad sell-off in sterling-denominated assets and exerting upward pressure on government bond yields.
Moreover, recent macroeconomic data have been weak, further compounding the political unease. Third-quarter economic growth was muted, with monthly GDP contracting in September. This follows earlier reports showing unemployment rising to a four-year high and wage growth slowing to its weakest pace since early 2022. Consequently, market expectations for a Bank of England rate cut in December have intensified.
Technical Analysis: GBP/USD
H4 Chart:
(Click on image to enlarge)
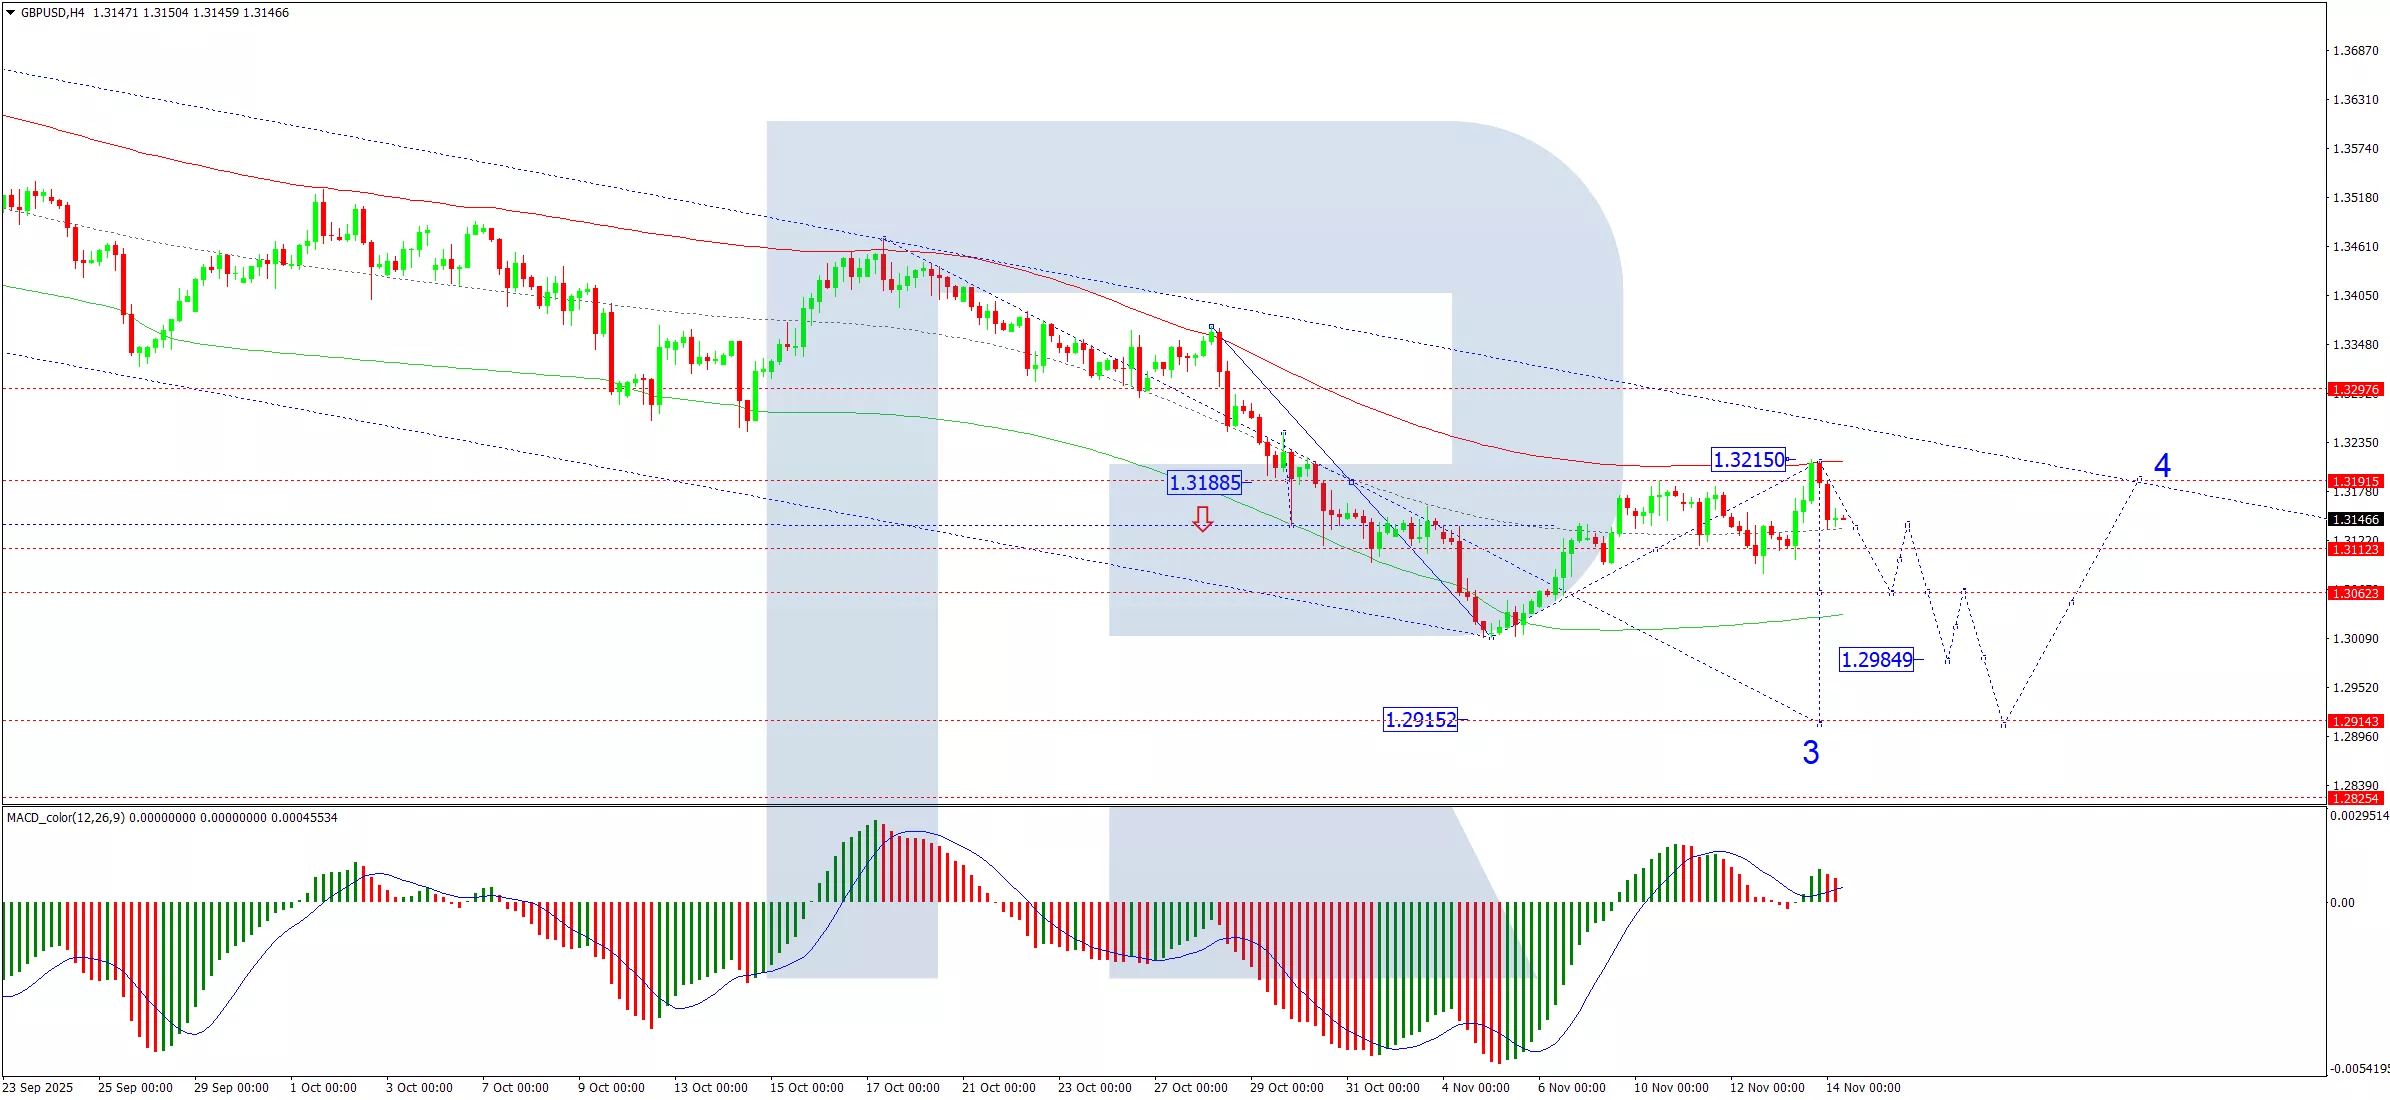
On the H4 chart, GBP/USD has completed a corrective wave at 1.3215. A decline towards 1.3062 is anticipated, likely to be followed by a minor rebound to 1.3131. This level is expected to form resistance within a new consolidation range. A subsequent downward breakout from this range would signal a resumption of the primary downtrend, opening the path towards 1.2985, with a further potential decline to at least 1.2915. This bearish scenario is supported by the MACD indicator. Its signal line, while above zero, has diverged bearishly from its histogram, suggesting the recent corrective bounce has ended and a new downward impulse is forming.
H1 Chart:
(Click on image to enlarge)
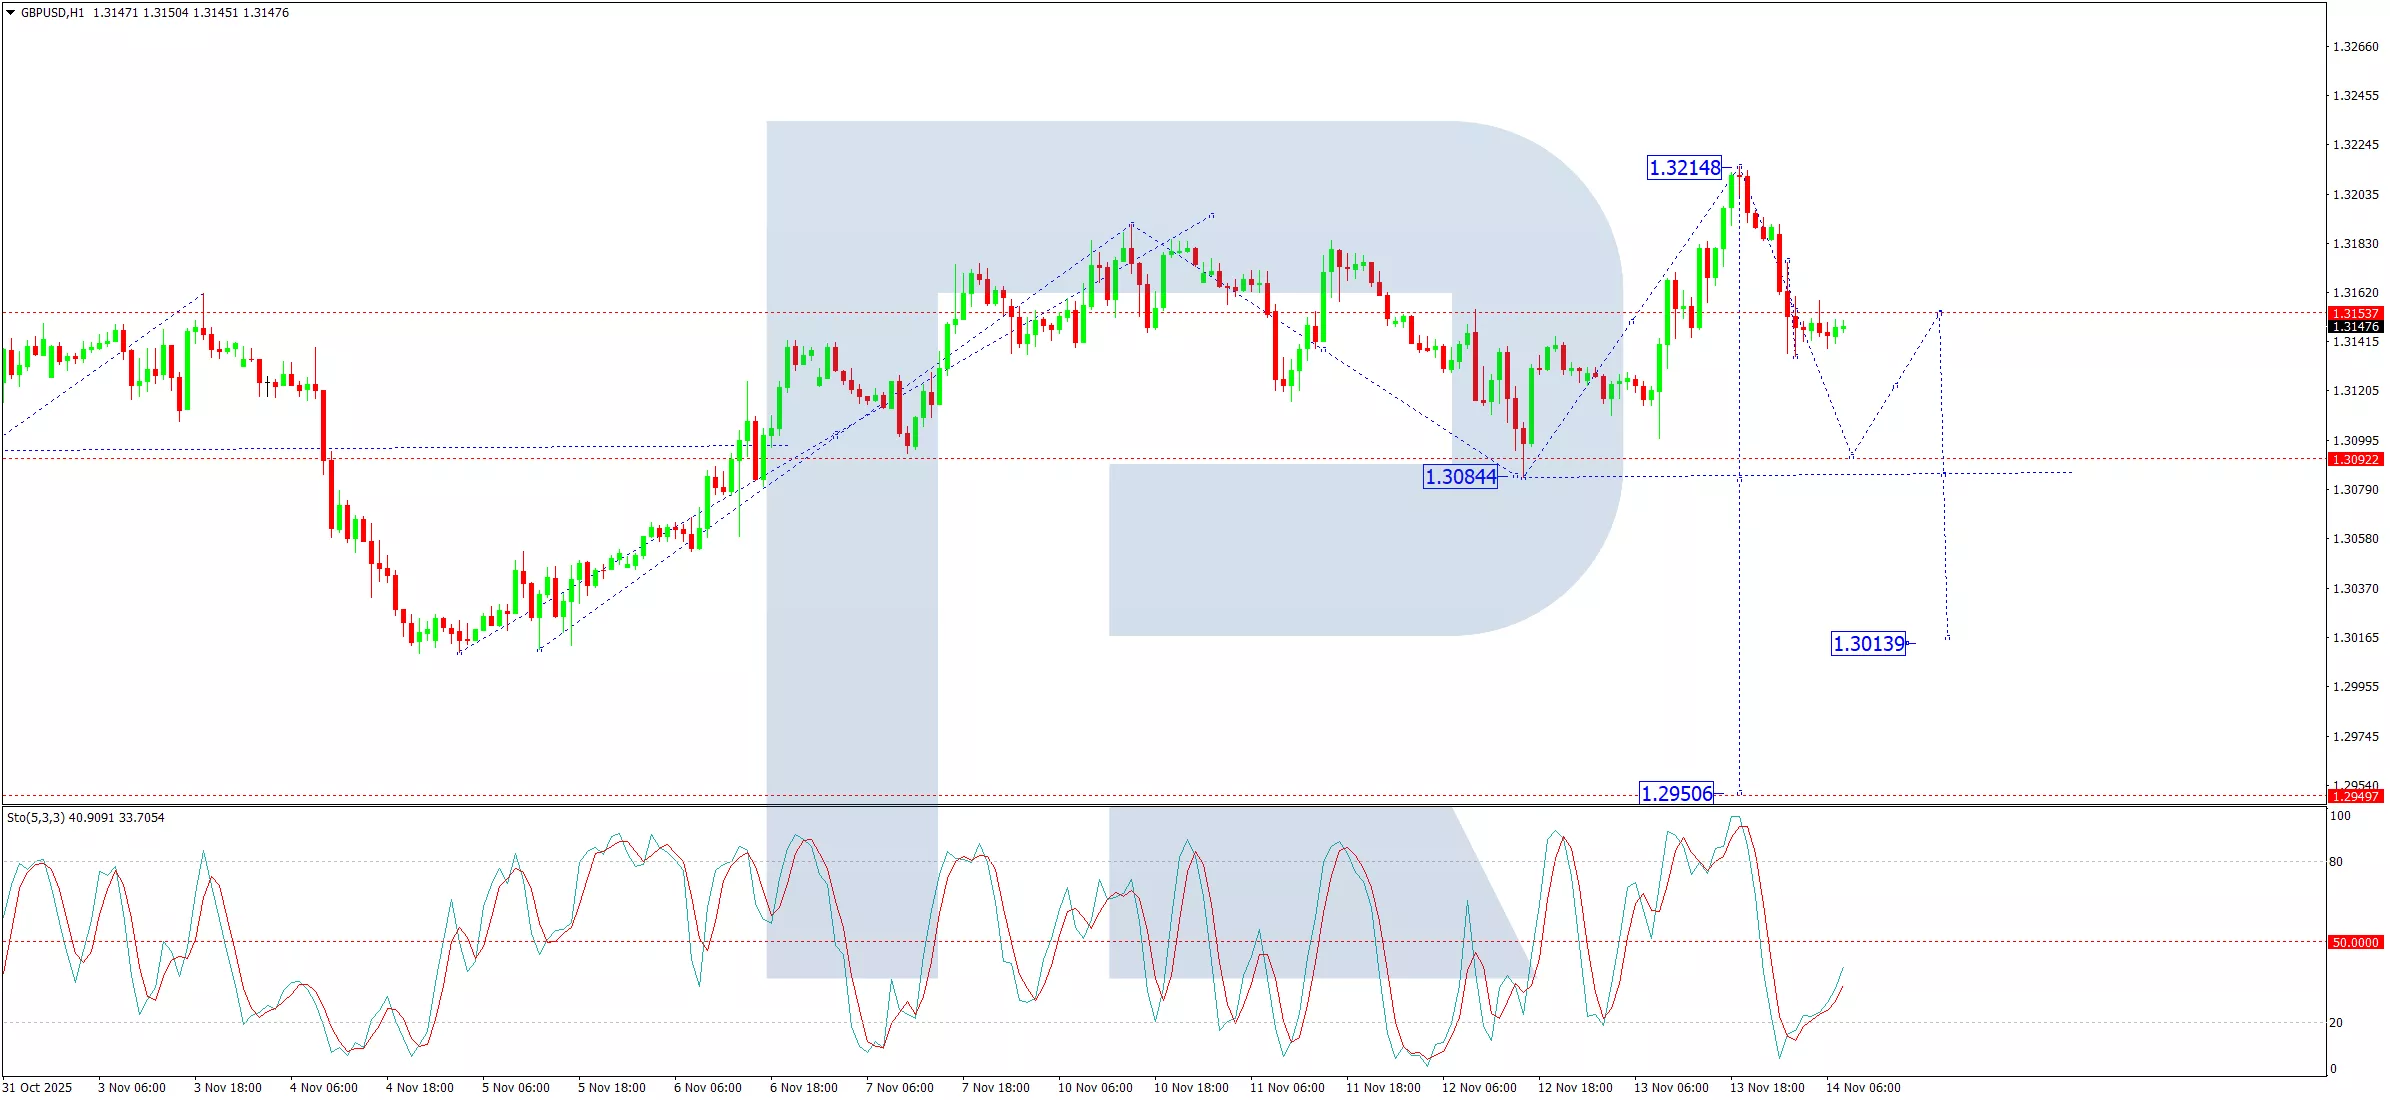
On the H1 chart, the pair has formed a consolidation range around 1.3153. We expect an initial decline to 1.3090, followed by a technical retracement to retest the 1.3153 level from below. This retest is likely to present a selling opportunity before the downtrend extends towards 1.3013. The Stochastic oscillator aligns with this view. Its signal line is deep in oversold territory at the 20 level, which, rather than suggesting a rebound, typically indicates sustained downward momentum in a strong trend.
Conclusion
The pound remains under heavy pressure, caught between political missteps that undermine fiscal credibility and a deteriorating economic backdrop that points to monetary easing. Technically, the pair maintains a clear bearish structure. Any near-term stability is likely to prove temporary, with the path of least resistance pointing towards a test of support at 1.2985 and potentially 1.2915.
More By This Author:
EUR/USD Holds Steady As US Government Shutdown Ends
Pound Succumbs To Pressure From Weak Labor Data
USD/JPY Climbs To Fresh Nine-Month High
Disclaimer: Any forecasts contained herein are based on the author's particular opinion. This analysis may not be treated as trading advice. RoboForex bears no responsibility for ...
more

