
Bullish view
- Buy the GBP/USD pair and set a take-profit at 1.3535.
- Add a stop-loss at 1.3485.
- Timeline: 1-2 days.
Bearish view
- Sell the GBP/USD pair and set a take-profit at 1.3485.
- Add a stop-loss at 1.3535.
(Click on image to enlarge)
The GBP/USD pair remained on edge at a crucial support level as traders waited for important macro data. It was trading at 1.3460 on Monday morning, down slightly from last week’s high of 1.3535. It remains much higher than the November low of 1.3000.
UK and US Macro Data to Shed Light on BoE and Fed Next Actions
The GBP/USD pair will be in the spotlight this week as the UK and the US publish key macro data. The Bank of England (BoE) will release the latest mortgage and lending data from November. Economists expect the data to show that mortgage approvals slipped to 64.5k in October from the previous 65k.
The other key UK macro data to watch will be the upcoming shop price inflation, which will come out on Tuesday morning. Economists expect the data to show that inflation rose slightly in December.
Additionally, top UK retailers like Tesco and Next will publish data on the volume of holiday shopping. These numbers will provide more information on the strength of the economy, which will impact the Bank of England in its next meetings.
Meanwhile, the US will publish a few reports showing the state of the labor market. ADP will publish the latest estimate of private payrolls data on Wednesday, with analysts expecting it to show that the economy created 50k jobs during the month.
Another labor report will be from the Bureau of Labor Statistics (BLS), which will show the number of vacancies in the US in November. Finally, the agency will release the latest non-farm payrolls data on Friday.
Economists polled by Reuters expect the data to show that the economy created 55k jobs last month as the unemployment rate softened from 4.6% to 4.5%. The labor report is important as it is one part of the Federal Reserve's dual mandate, with the other part being on inflation.
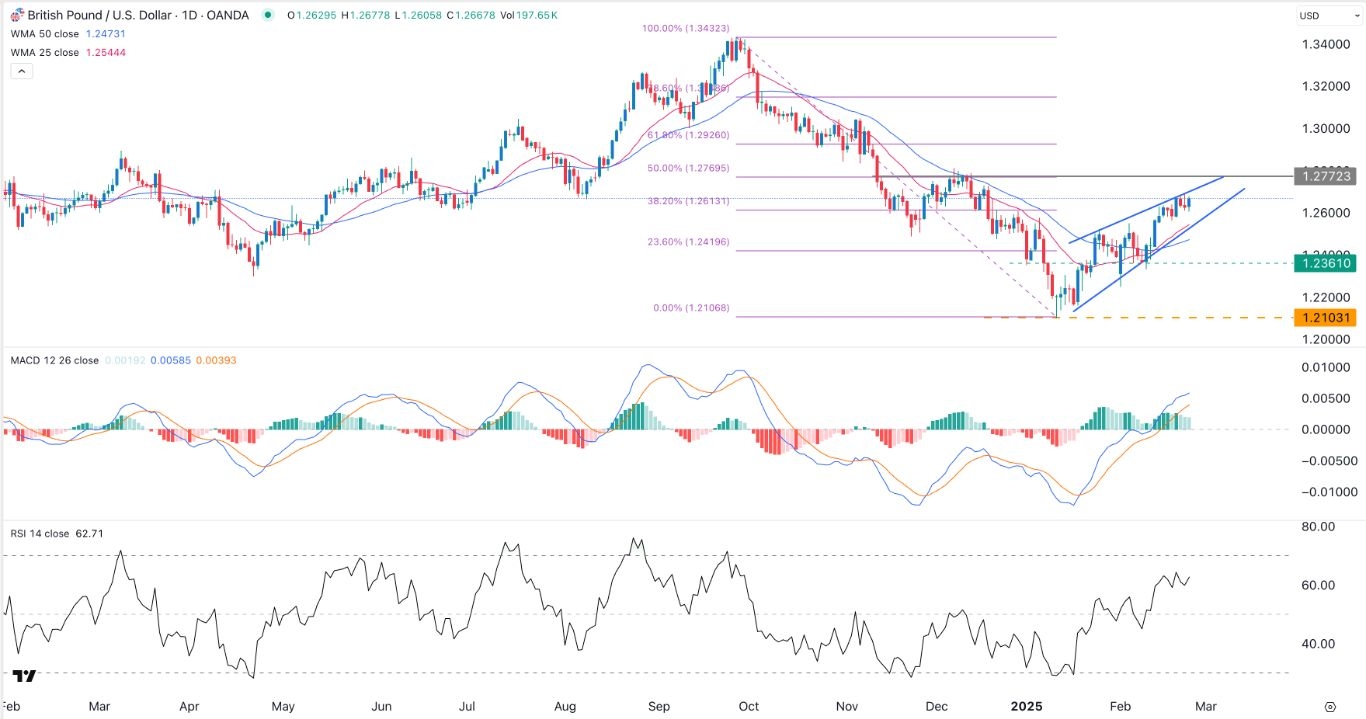
GBP/USD Technical Analysis
The daily timeframe chart shows that GBP/USD exchange rate has bounced back in the past few weeks, moving from a low of 1.3000 in November to the current 1.3460. It has formed an ascending channel and is now hovering near its lowest level.
The pair has remained above the 50-day Exponential Moving Average (EMA)and the Supertrend indicator. It is also slightly above the Ichimoku cloud, a sign that the bullish outlook continues.
Therefore, the pair will likely resume the uptrend and possibly retest last month’s high of 1.3535. A move above that level will point to more gains, potentially to the psychological level at 1.3600.
More By This Author:
BMNR Stock Forecast As BitMine Shareholders Votes On Increasing Share Count
Copper Price Soared To A Record High: What Next?
Crude Oil Price Analysis: Here’s What To Expect In 2026


Comments
Log in or sign up to join the conversation.