GBP/USD Forex Signal: Bearishness Persists As The US Dollar Rebounds
Bearish view
- Sell the GBP/USD pair and set a take-profit at 1.3250.
- Add a stop-loss at 1.3450.
- Timeline: 1-2 days.
Bullish view
- Buy the GBP/USD pair and set a take-profit at 1.3450.
- Add a stop-loss at 1.3250.
(Click on image to enlarge)

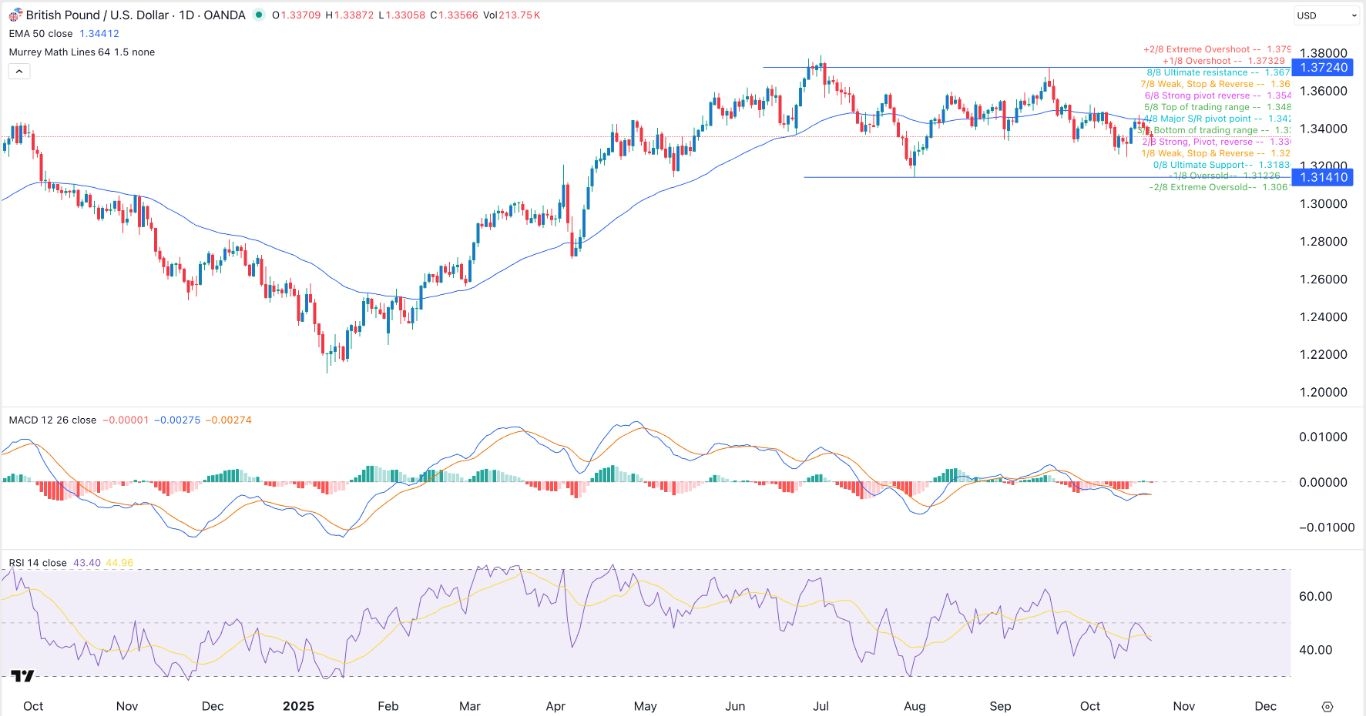
The GBP/USD exchange rate pulled back even as the UK published strong consumer inflation data. It dropped for four consecutive days, reaching its lowest level since October 15. It has dropped by almost 3% from the year-to-date high.
UK and US Inflation Data
The GBP/USD pair dropped after a report by the Office of National Statistics (ONS) showed that the UK’s inflation held steady at 3.8% in September, while the core inflation slowed from 3.6% to 3.5%. Similarly, the Producer Price Index (PPI) remained above 3.4%.
While most of these numbers were lower than expected, they remained much higher than the Bank of England’s target of 2.0%. As a result, the bank will likely maintain interest rates steady in the upcoming meeting in November this year.
The next key news for the GBP/USD pair will be the upcoming UK retail sales numbers, which will provide more color on the state of the economy. Economists expect the data to show that retail sales dropped by 0.2% in September after growing by 0.5%.
The GBP/USD pair will also react to the upcoming US inflation report, which is the only government data to come out this month because of the ongoing shutdown. Economists see the data coming in at 3.1% and the core CPI rising to 3.2%. A higher inflation figure than expected will make it difficult to cut interest rates in its next week’s meeting.
The GBP/USD exchange rate has also reacted to the relatively strong US dollar. Data shows that the dollar index has jumped to $100 from the year-to-date low of $96. It has jumped because of its role as a safe-haven asset during the government shutdown.
GBP/USD Technical Analysis
The daily chart shows that the GBP/USD pair has pulled back in the past few months. It has moved from a high of 1.3724 in September to the current 1.3360.
The pair has moved below the 50-day Exponential Moving Average (EMA) and the bottom of the trading range of the Murrey Math Lines Indicator.
It has formed a double-top pattern, which is a common bearish reversal pattern. Also, oscillators like the Relative Strength Index (RSI) and the MACD have all pointed downwards.
Therefore, the pair will likely continue falling as the US dollar strength continues. If this continues, the next key support level to watch will be at 1.3140, its lowest point in August.
More By This Author:
BTC/USD Forex Signal: Bitcoin Outlook Persists As Fear And Greed Index Slumps
BTC/USD Forex Signal: Bitcoin Rally Losing Steam
BTC/USD Forex Signal: Bitcoin Price May Crash Again Soon
Risk Disclaimer: DailyForex will not be held liable for any loss or damage resulting from reliance on the information contained within this website including market news, analysis, trading signals ...
more


