BTC/USD Forex Signal: Bitcoin Rally Losing Steam
Bearish view
- Sell the BTC/USD pair and set a take-profit at 107,000.
- Add a stop-loss at 114,000.
- Timeline: 1-2 days.
Bullish view
- Sell the BTC/USD pair and set a take-profit at 114,000.
- Add a stop-loss at 107,000
(Click on image to enlarge)

The BTC/USD pair remained steady above the important resistance level at 111,000 as the US dollar steadied and gold plunged. Bitcoin price was trading at $111,300, much higher than this month's low of 103,500.
Bitcoin Price Steady Despite ETF Outflows
The BTC/USD pair was steady even as demand from American institutional investors waned. Data compiled by SoSoValue shows that spot Bitcoin ETFs shed over $1.2 billion in assets last week as the coin retreated. The outflows have also continued this week as investors stay on the sidelines.
Meanwhile, gold, which had been on a strong uptrend, suffered a significant drop as investors began to book profits amid falling risks and strong corporate earnings. Gold fell to $4,200, down sharply from the year-to-date high of $4,365.
The US Dollar Index, on the other hand, rose slightly as the US dollar strengthened against key currencies, including the euro and the pound sterling. Bitcoin and the greenback tend to have a close correlation with each other.
The BTC/USD pair also steadied after the Federal Reserve moved to embrace cryptocurrencies. The bank held a conference with top officials in the industry, with Christopher Waller noting that the bank would not remain on the sidelines.
BTC/USD Technical Analysis
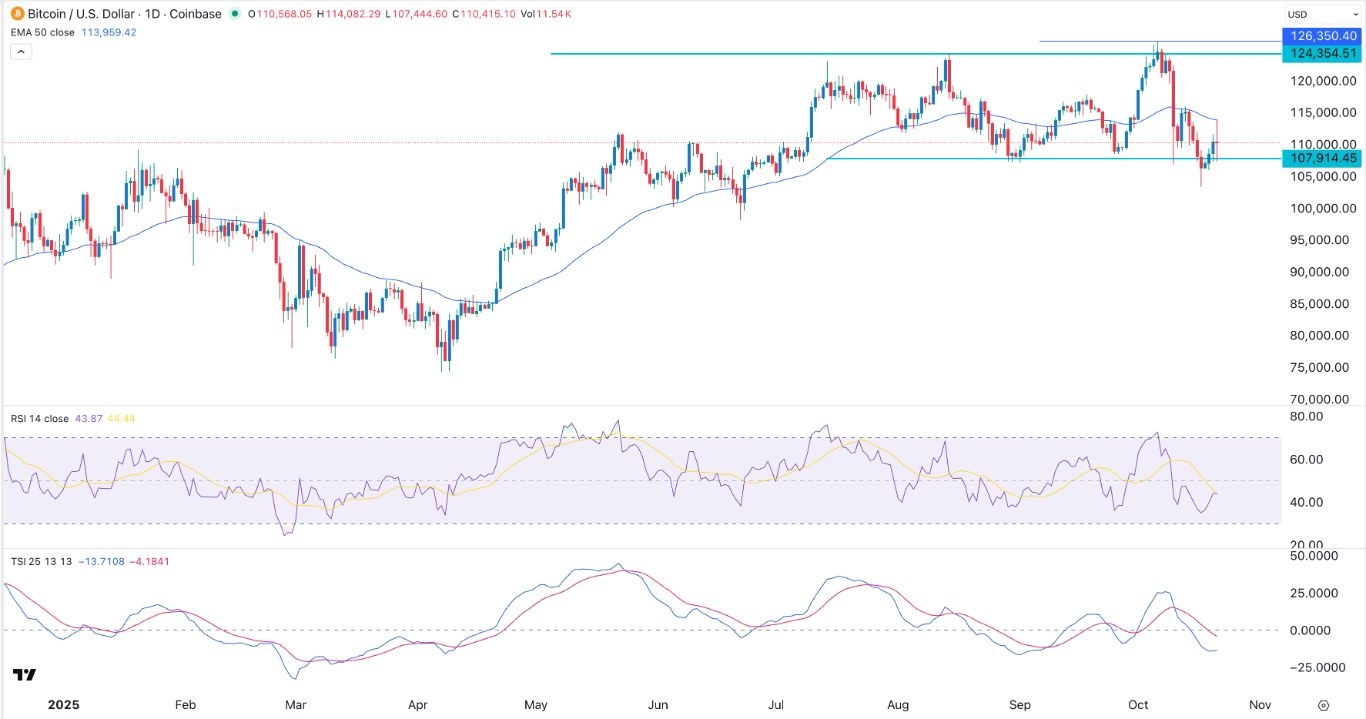
The daily timeframe chart shows that the BTC/USD pair has remained under pressure in the past few weeks, moving from the all-time high of 126,350 in October to 111,300 today.
Bitcoin has moved below the important support level at 124,354, its highest level on August 14. It remains below the 50-day Exponential Moving Average (EMA).
However, the True Strength Index (TSI) and the Average Directional Index (ADX) have continued falling, a sign that the ongoing recovery is not all that strong.
The Relative Strength Index (RSI) has moved below the neutral point at 50. Therefore, the pair will likely resume the downward trend, potentially to this week’s low of 103,620.
The bearish outlook will be invalidated if the pair moves above the 50-day Exponential Moving Average at 113,960 will invalidate the bearish outlook.
More By This Author:
BTC/USD Forex Signal: Bitcoin Price May Crash Again SoonTop Nasdaq 100 Index And QQQ ETF Stocks To Watch This Week
EUR/USD Forex Signal: Risky Pattern Forms Ahead Of Key Fed, ECB Statements
Risk Disclaimer: DailyForex will not be held liable for any loss or damage resulting from reliance on the information contained within this website including market news, analysis, trading signals ...
more


