
- GBP/USD is back above the 1.2100 figure, courtesy of the US Dollar weakness.
- China’s relaxing Covid-19 restrictions keep sentiment positive.
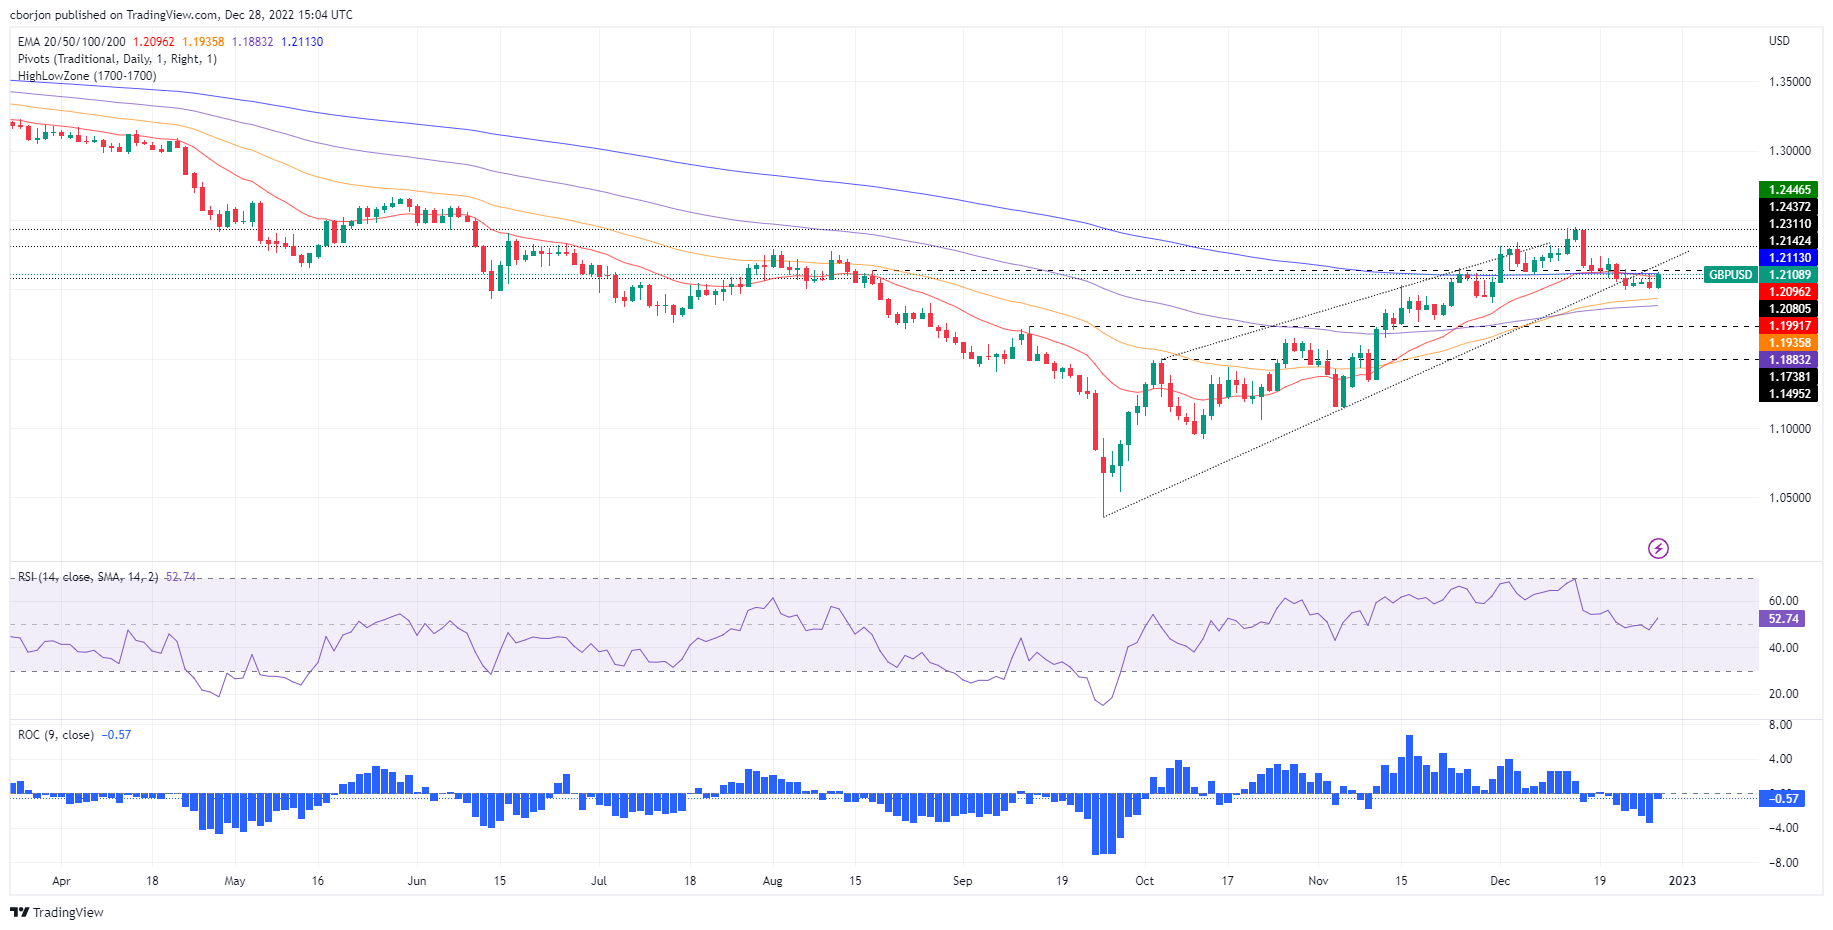
- GBP/USD> Testing the 20 and 200-DMAs, on its way toward 1.2200.
The Pound Sterling advances sharply following a European choppy trading session, bouncing off the day’s lows around 1.2000, posing a challenge to the 1.2100 figure in the New York session. At the time of writing, the GBP/USD is trading at 1.2108.
Improvement in sentiment weighs on the USD
Investors’ mood is mixed amidst the North American session. The lack of US economic data, with the US Redbook, released around 13:55 GMT, coming at 9.6% YoY, compared to the previous reading of 7.6%, failed to underpin the US Dollar (USD). Later at 15:00 GMT, US Pending Home Sales for November and the Richmond Fed Indices are expected to improve slightly compared to its previous readings.
Another factor that improved traders’ sentiment is that China is removing Covid-19 restrictions on visitors while beginning to issue travel permits to Hong kong residents. Additionally, authorities started to issue passports and would officially reopen its borders on January 8. Even though the mood shifted positively, fears that inflationary pressures would rise to keep traders wary.
In the meantime, the US Dollar Index (DXY), a gauge of the buck’s value against a basket of peers, losses 0.28%, down at 103.984, undermined by falling US Treasury bond yields.
Ahead into the week, the UK economic docket is empty, while the US calendar will feature Initial Jobless Claims for the week ending on December 23, ahead of the release of the Chicago PMI on Friday.
GBP/USD Price Analysis: Technical outlook
From the daily chart perspective, the GBP/USD is testing the 20 and 200-day Exponential Moving Average (EMA) at 1.2113 after bouncing from weekly lows around 1.2000. If the former is cleared, the nest resistance would be an upslope trendline previous support-shifted- resistance around 1.2180, followed by the 1.2200 figure. On the flip side, failure to stay above 1.2100 could pave the way toward weekly lows at 1.2000 and the 50-day EMA at 1.1935.
(Click on image to enlarge)
GBP/USD
| OVERVIEW | |
|---|---|
| Today last price | 1.2108 |
| Today Daily Change | 0.0080 |
| Today Daily Change % | 0.67 |
| Today daily open | 1.2028 |
| TRENDS | |
|---|---|
| Daily SMA20 | 1.2178 |
| Daily SMA50 | 1.1858 |
| Daily SMA100 | 1.1671 |
| Daily SMA200 | 1.2063 |
| LEVELS | |
|---|---|
| Previous Daily High | 1.2112 |
| Previous Daily Low | 1.2002 |
| Previous Weekly High | 1.2242 |
| Previous Weekly Low | 1.1992 |
| Previous Monthly High | 1.2154 |
| Previous Monthly Low | 1.1147 |
| Daily Fibonacci 38.2% | 1.2044 |
| Daily Fibonacci 61.8% | 1.207 |
| Daily Pivot Point S1 | 1.1982 |
| Daily Pivot Point S2 | 1.1937 |
| Daily Pivot Point S3 | 1.1872 |
| Daily Pivot Point R1 | 1.2092 |
| Daily Pivot Point R2 | 1.2157 |
| Daily Pivot Point R3 | 1.2202 |
More By This Author:
US Dollar To Be More Stable In 2023 After Initial Weakness In Q1 – Credit Suisse
EUR/USD Price Analysis: Grinds Higher Past 100, 200 HMA Confluence
Silver Price Analysis: XAG/USD Fails Again To Hold Above $24.20


Comments
Log in or sign up to join the conversation.