
- EUR/USD prints a three-day uptrend as it seesaws around the intraday top.
- MACD teases buyers but rising wedge formation challenges upside momentum.
- One-week-old horizontal support adds to the downside filters.
EUR/USD stays defensive around 1.0645, portraying a three-day winning streak amid a sluggish Wednesday morning in Europe.
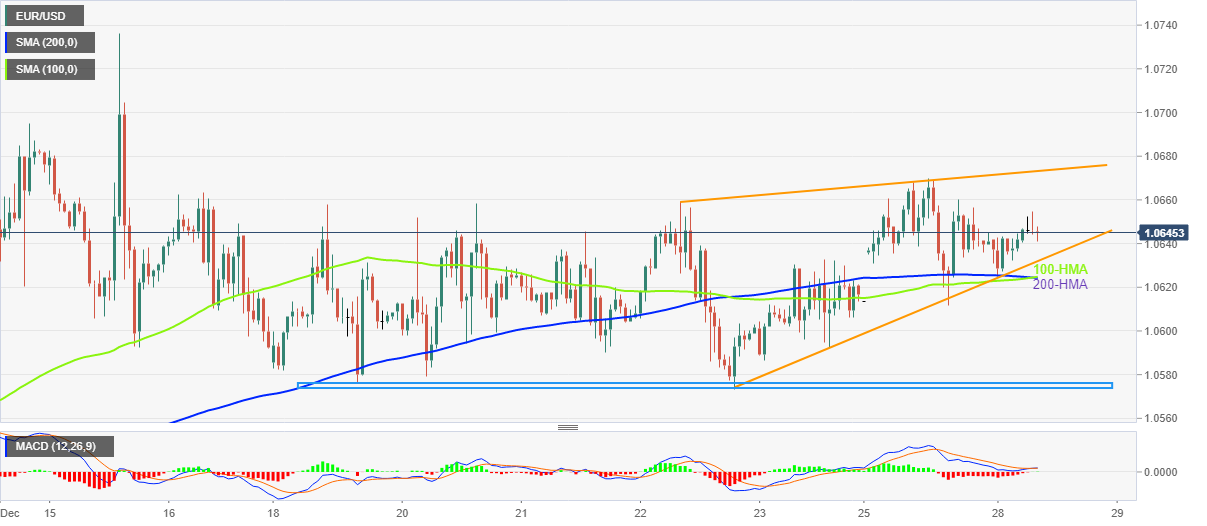
In doing so, the major currency pair justifies the previous bounce off the key Hourly Moving Averages (HMAs) inside a short-term rising wedge bearish chart formation.
It’s worth noting that the impending bull cross on the MACD and the quote’s sustained trading beyond the 100 and 200-HMA confluence, near 1.0620, keep the EUR/USD buyers hopeful.
Also favoring the EUR/USD bulls is the quote’s U-turn from the 1.0580-75 horizontal support area.
However, a rejection of the three-day-old rising wedge is necessary for the pair buyer’s conviction. As a result, successful trading beyond 1.0675 could push back the sellers.
Following that, an uptick to the monthly high flashed on December 15, around 1.0735, becomes imminent.
In the case where the EUR/USD price remains firmer past 1.0735, May’s peak of 1.0786 and the 1.0800 round figure will be in the spotlight.
On the contrary, a downside break of 1.0630 will confirm the rising wedge bearish formation. Even so, the convergence of the stated HMAs, near 1.0620, could challenge the EUR/USD bears.
Should the EUR/USD remains weak past 1.0620, the one-week-old horizontal support area surrounding 1.0580-75, holds the key to the pair’s south-run towards the monthly low near 1.0390.
EUR/USD: Hourly chart
(Click on image to enlarge)
Trend: Limited upside expected
Additional Important Levels
| OVERVIEW | |
|---|---|
| Today last price | 1.0646 |
| Today Daily Change | 0.0005 |
| Today Daily Change % | 0.05% |
| Today daily open | 1.0641 |
| TRENDS | |
|---|---|
| Daily SMA20 | 1.0569 |
| Daily SMA50 | 1.0296 |
| Daily SMA100 | 1.0115 |
| Daily SMA200 | 1.033 |
| LEVELS | |
|---|---|
| Previous Daily High | 1.067 |
| Previous Daily Low | 1.0612 |
| Previous Weekly High | 1.0659 |
| Previous Weekly Low | 1.0573 |
| Previous Monthly High | 1.0497 |
| Previous Monthly Low | 0.973 |
| Daily Fibonacci 38.2% | 1.0648 |
| Daily Fibonacci 61.8% | 1.0634 |
| Daily Pivot Point S1 | 1.0612 |
| Daily Pivot Point S2 | 1.0583 |
| Daily Pivot Point S3 | 1.0554 |
| Daily Pivot Point R1 | 1.067 |
| Daily Pivot Point R2 | 1.0699 |
| Daily Pivot Point R3 | 1.0728 |
More By This Author:
Silver Price Analysis: XAG/USD Fails Again To Hold Above $24.20EUR/USD Rejected At 1.0665, Remains Steady Above 1.0640
Forex Today: US Dollar Weakens To Start Last Trading Week Of 2022


Comments
Log in or sign up to join the conversation.