EUR/USD Price Analysis: Some Consolidation Appears On The Table
- EUR/USD partially reverses Monday’s marked gains.
- The pair could trade in a range bound theme in the short term.
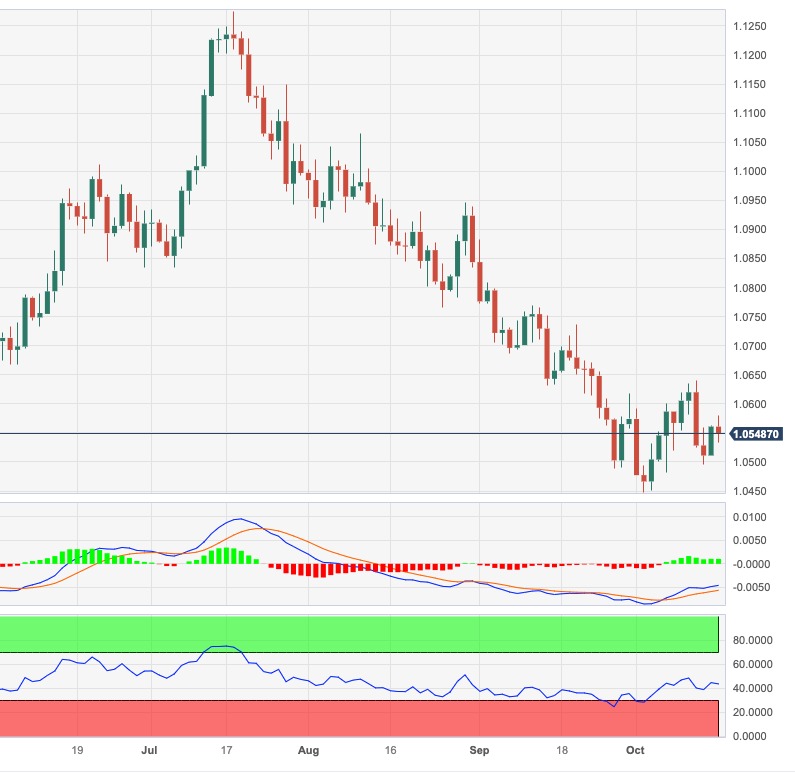
EUR/USD fades the earlier bullish attempt to the 1.0580 region on Tuesday.
In case bulls regain the upper hand, the pair should surpass the monthly peak of 1.0639 (October 12) to allow for extra gains to, initially, the interim 55-day SMA at 1.0735 ahead of the weekly top of 1.0767 (September 12).
Meanwhile, further losses remain on the table as long as the pair navigates the area below the key 200-day SMA
EUR/USD daily chart
EUR/USD
| OVERVIEW | |
|---|---|
| Today last price | 1.055 |
| Today Daily Change | 47 |
| Today Daily Change % | -0.10 |
| Today daily open | 1.0561 |
| TRENDS | |
|---|---|
| Daily SMA20 | 1.0571 |
| Daily SMA50 | 1.0721 |
| Daily SMA100 | 1.0832 |
| Daily SMA200 | 1.0824 |
| LEVELS | |
|---|---|
| Previous Daily High | 1.0563 |
| Previous Daily Low | 1.0511 |
| Previous Weekly High | 1.064 |
| Previous Weekly Low | 1.0496 |
| Previous Monthly High | 1.0882 |
| Previous Monthly Low | 1.0488 |
| Daily Fibonacci 38.2% | 1.0543 |
| Daily Fibonacci 61.8% | 1.0531 |
| Daily Pivot Point S1 | 1.0527 |
| Daily Pivot Point S2 | 1.0493 |
| Daily Pivot Point S3 | 1.0475 |
| Daily Pivot Point R1 | 1.0579 |
| Daily Pivot Point R2 | 1.0597 |
| Daily Pivot Point R3 | 1.063 |
More By This Author:
EUR/JPY Price Analysis: Extra Consolidation Looks Likely
Natural Gas Futures - Further Decline On The Cards
Crude Oil Futures: Extra Pullbacks Not Favoured
Disclosure: Information on this article contains forward-looking statements that involve risks and uncertainties. Markets and instruments profiled on this page are for informational purposes ...
more


