EUR/USD Price Analysis: Bulls Need To Clear The 1.0700 Region

Image Source: Pixabay
- EUR/USD comes under some selling pressure near 1.0650.
- The pair’s bullish attempt falters once again ahead of 1.0700.
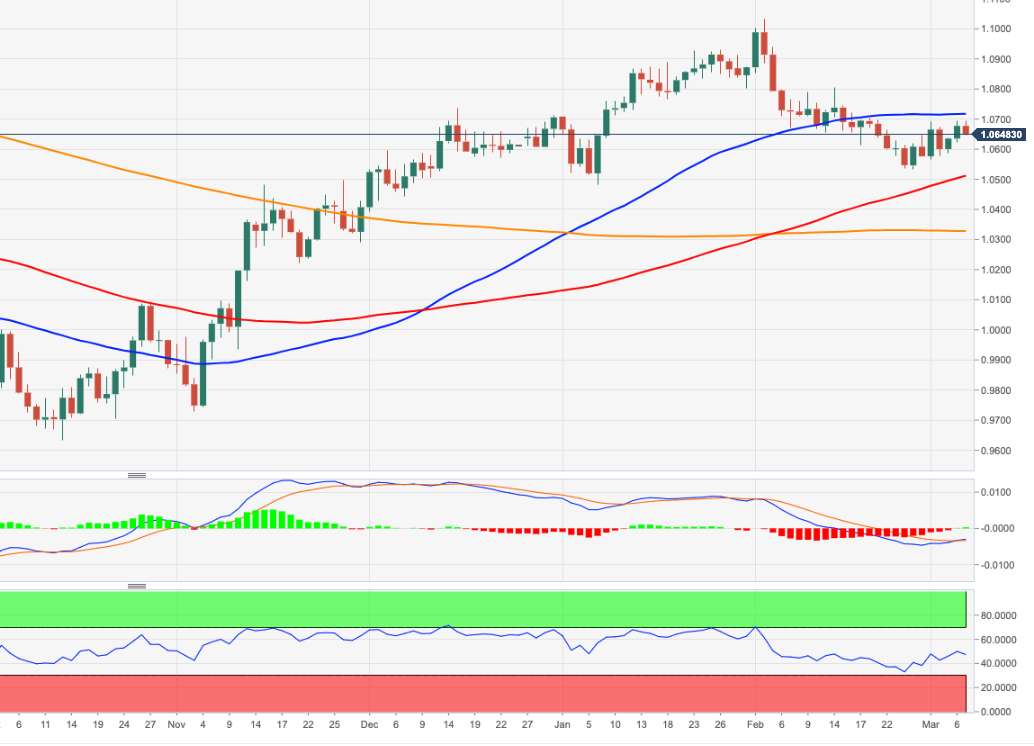
EUR/USD triggered a corrective knee-jerk following another attempt to test/surpass the 1.0700 neighborhood on Tuesday.
The resumption of the buying interest should encourage the pair to challenge and leave behind the 1.0700 region as well as the provisional 55-day SMA (1.0716) to allow for a potential visit to the weekly top at 1.0804 (February 14).
Looking at the longer run, the constructive view remains unchanged while above the 200-day SMA, today at 1.0326.
EUR/USD daily chart
(Click on image to enlarge)
EUR/USD
| OVERVIEW | |
|---|---|
| Today last price | 1.0649 |
| Today Daily Change | 47 |
| Today Daily Change % | -0.26 |
| Today daily open | 1.0677 |
| TRENDS | |
|---|---|
| Daily SMA20 | 1.0661 |
| Daily SMA50 | 1.0728 |
| Daily SMA100 | 1.0504 |
| Daily SMA200 | 1.0328 |
| LEVELS | |
|---|---|
| Previous Daily High | 1.0694 |
| Previous Daily Low | 1.0622 |
| Previous Weekly High | 1.0692 |
| Previous Weekly Low | 1.0533 |
| Previous Monthly High | 1.1033 |
| Previous Monthly Low | 1.0533 |
| Daily Fibonacci 38.2% | 1.0667 |
| Daily Fibonacci 61.8% | 1.065 |
| Daily Pivot Point S1 | 1.0635 |
| Daily Pivot Point S2 | 1.0593 |
| Daily Pivot Point S3 | 1.0563 |
| Daily Pivot Point R1 | 1.0707 |
| Daily Pivot Point R2 | 1.0737 |
| Daily Pivot Point R3 | 1.0779 |
More By This Author:
Natural Gas Futures: Further Downside Appears Limited
USD Index Price Analysis: No Changes To The Current Consolidation
USD Index Price Analysis: Further Consolidation In The Pipeline
Disclosure: Information on this article contains forward-looking statements that involve risks and uncertainties. Markets and instruments profiled on this page are for informational purposes ...
more


