

Image Source: Pexels
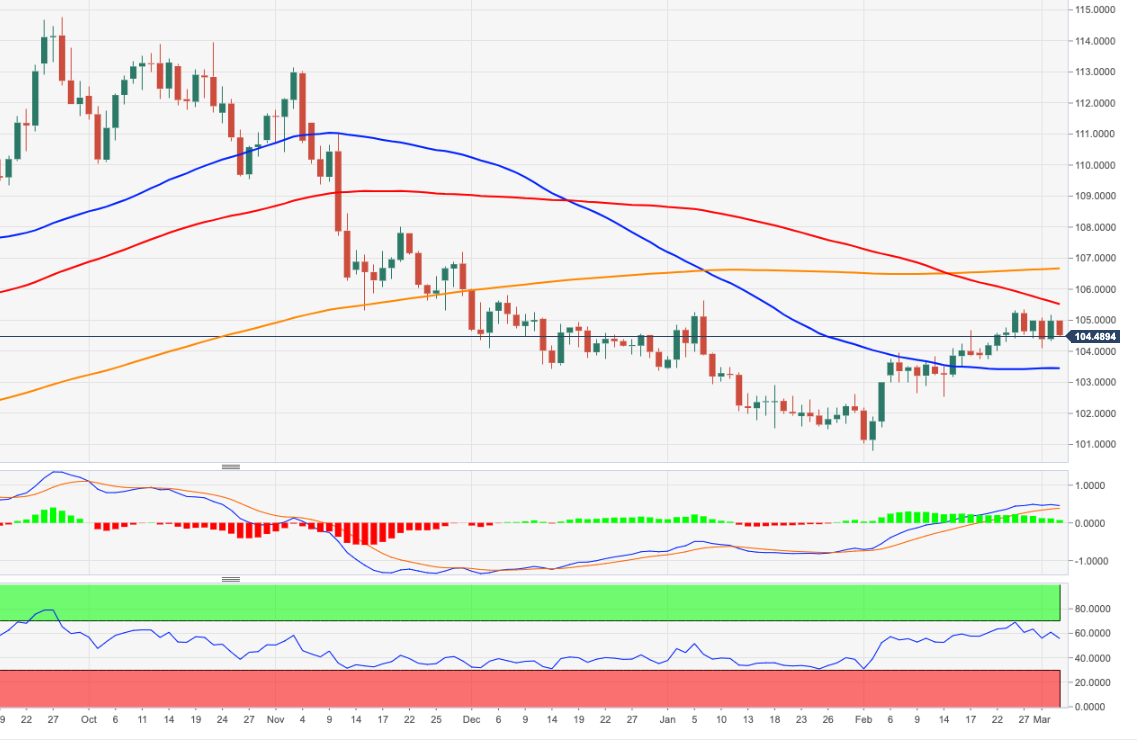
- DXY manages to regain some composure and tests 104.70.
- Further range bound trade looks likely for the time being.
DXY trades within a narrow range at in the mid-104.00s at the beginning of the week.
So far, the continuation of the range bound theme seems the most likely scenario in the very near term for the index. In the meantime, the dollar needs to clear the February peak at 105.35 (February 27) to allow for extra recovery and a potential challenge of the 2023 top at 105.63 (January 6).
In the longer run, while below the 200-day SMA at 106.55, the outlook for the index remains negative.
DXY daily chart
(Click on image to enlarge)
Dollar Index Spot
| OVERVIEW | |
|---|---|
| Today last price | 104.5 |
| Today Daily Change | 35 |
| Today Daily Change % | -0.02 |
| Today daily open | 104.52 |
| TRENDS | |
|---|---|
| Daily SMA20 | 104.08 |
| Daily SMA50 | 103.37 |
| Daily SMA100 | 104.94 |
| Daily SMA200 | 106.82 |
| LEVELS | |
|---|---|
| Previous Daily High | 105.01 |
| Previous Daily Low | 104.48 |
| Previous Weekly High | 105.36 |
| Previous Weekly Low | 104.09 |
| Previous Monthly High | 105.36 |
| Previous Monthly Low | 100.81 |
| Daily Fibonacci 38.2% | 104.69 |
| Daily Fibonacci 61.8% | 104.81 |
| Daily Pivot Point S1 | 104.33 |
| Daily Pivot Point S2 | 104.14 |
| Daily Pivot Point S3 | 103.8 |
| Daily Pivot Point R1 | 104.86 |
| Daily Pivot Point R2 | 105.2 |
| Daily Pivot Point R3 | 105.39 |
More By This Author:
USD Index Price Analysis: Further Consolidation In The PipelineNatural Gas Futures: Scope For Further Gains
USD Index Price Analysis: Consolidation Likely Ahead Of Further Gains


Comments
Log in or sign up to join the conversation.