Tuesday, April 28, 2020 3:32 AM EST
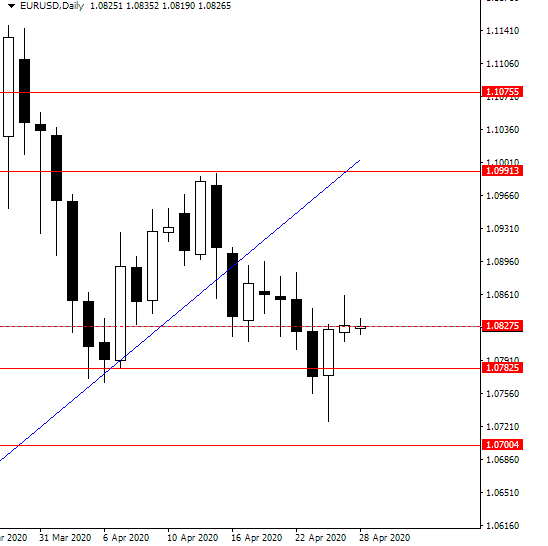
Yesterday we had a bearish Pinbar on the daily time frame but its configuration is not something that I would say is a perfect one to give me a strong signal that the price will move down.

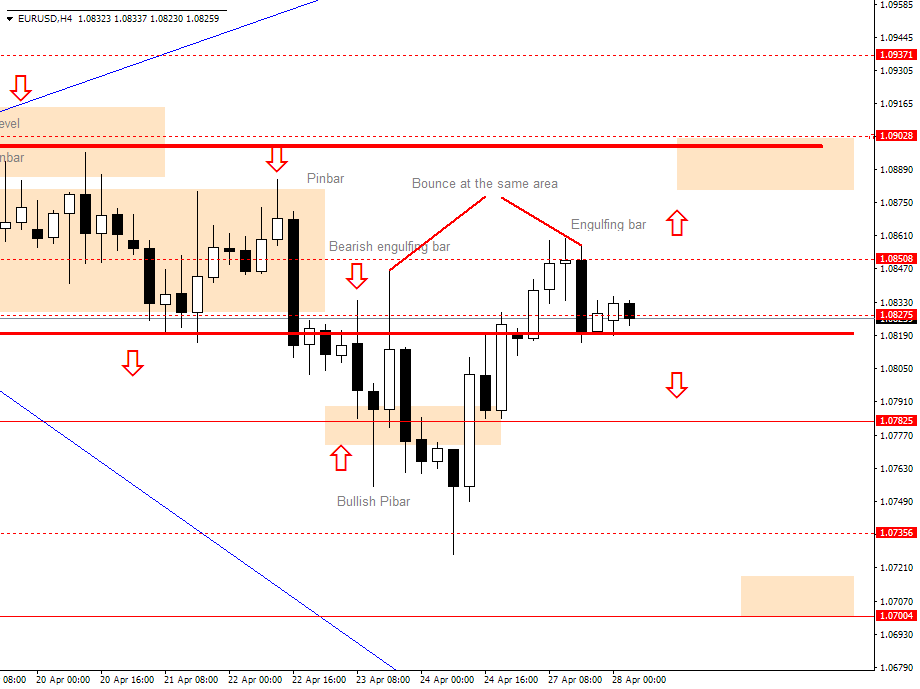
Looking at the H4 time frame I see a bearish engulfing bar which has formed after an indecision candle. That suggests the price could move down but for me that engulfing bar is not the perfect one. I like to see engulfing bars covering previous candle highs.
Now the price has bounced from the previous range (area between 1.08275 – 1.08508) but the candle close on the H4 time frame did not close below the previous H4 bearish candle close. It is the candle close which pushed the price below to 1.07825 on the April 22.

For now, the price has stalled and we need to wait and see what the price is going to do so we can decide in which direction to trade.
The price could continue down to 1.07825 and make a pullback before going further down. Also, it can go up and make a bounce from the previous confluence level at 1.09028.
While we have indecision the best thing to do is to wait until the price makes a clear move and gives us a perfect signal to enter and open an order.
It is the price move on Tuesday which will determine the direction for the next two days. We will wait and see what is going to happen with that.
Disclaimer: Any Advice or information is General Advice Only – It does not take into account your personal circumstances, please do not trade or invest based solely on this information. By ...
more
Disclaimer: Any Advice or information is General Advice Only – It does not take into account your personal circumstances, please do not trade or invest based solely on this information. By Viewing any material or using the information you agree that this is general education material and you will not hold any person or entity responsible for loss or damages resulting from the content or general advice provided here by author. Futures, options, and spot currency trading have large potential rewards, but also large potential risk. You must be aware of the risks and be willing to accept them in order to invest in the futures and options markets. Don’t trade with money you can’t afford to lose. This is neither a solicitation nor an offer to Buy/Sell futures, spot Forex, CFD’s, options or other financial products. No representation is being made that any account will or is likely to achieve profits or losses similar to those discussed in any material provided by this author. The past performance of any trading system or methodology is not necessarily indicative of future results.
High Risk Warning: Forex, Futures, and Options trading has large potential rewards, but also large potential risks. The high degree of leverage can work against you as well as for you. You must be aware of the risks of investing in Forex, futures, and options and be willing to accept them in order to trade in these markets. Forex trading involves substantial risk of loss and is not suitable for all investors. Please do not trade with borrowed money or money you cannot afford to lose. Any opinions, news, research, analysis, prices, or other information contained in this article, is provided as general market commentary and does not constitute investment advice. I will not accept liability for any loss or damage, including without limitation to, any loss of profit, which may arise directly or indirectly from the use of or reliance on such information. Please remember that the past performance of any trading system or methodology is not necessarily indicative of future results.
less
How did you like this article? Let us know so we can better customize your reading experience.


What's a "pinbar?"
Pinbar is a candle formation that looks like on the chart above next to word "Pinbar".
It has long wick(or shadow) on one side and small wick(or shadow) on other side.
Where is smaller wick on that side you have small body.
Body represents the area between open and close price of the observed time frame. In case on the image above that is in 4 hour time frame.
On the side where is long wick like on the bullish Pinbar, you can interpret market condition like this:
Many sellers have exit from their trade to take profit out. Simultaneously buyers have enter into the trade and pushed the price up.
But, as there are many sellers they did not allow price to close to high which make a small body.
The 4 hour time frame ended with candle that represents that buyers were very strong and the price could move up.
It represents a possible reverse in market trend what happened and the price was pushed back.
I hope this helps to understand market candle price action formation. If it is unclear just ask.
I don't know, sorry. Hopefully the author will answer.