
EURUSD Approaches Final Triangle Leg

Photo by Christian Dubovan on Unsplash
EURUSD, as you know, has been trapped in a triangle for the last few months, and it now looks like the market could be turning lower for a final wave E within this contracting range. At the start of 2026, we could see the pair moving into some interesting support areas where this pattern may complete. The first support comes in around 1.1657, followed by a deeper support near the 1.1561 area; zones where wave E could potentially come to an end. So for now, the move lower appears to be underway, especially after the break of channel support around 1.1750 at the end of December. But after this corrective phase is done, we would expect more upside on the euro.
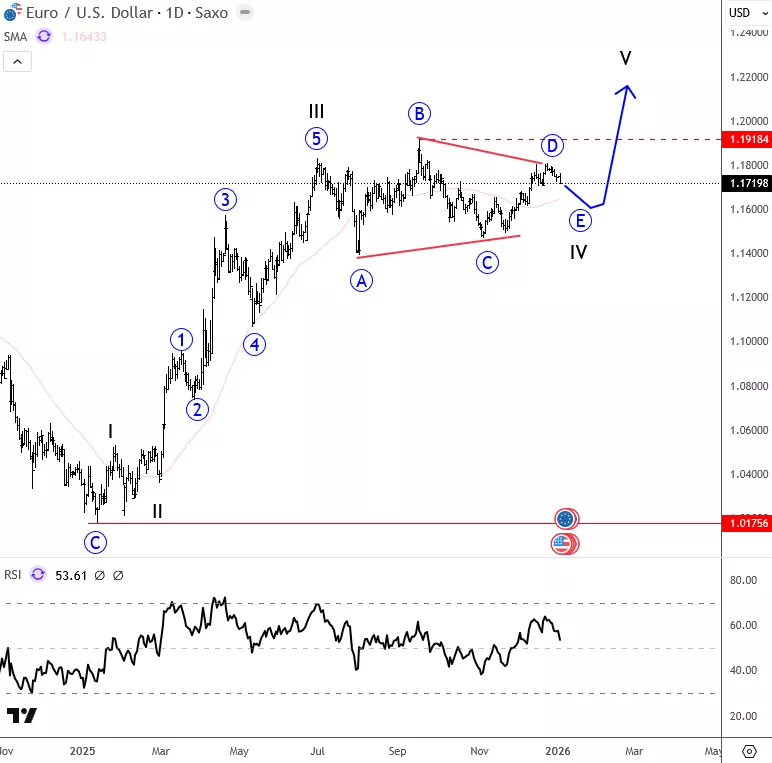
EURUSD Daily Chart
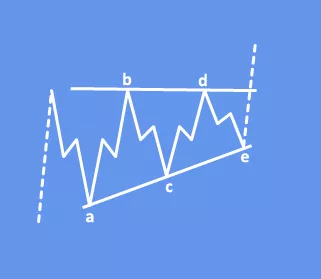
A bullish running triangle is a continuation pattern that forms when price consolidates while maintaining strong underlying demand. Unlike a regular triangle, the final corrective wave fails to reach the prior extreme, showing that buyers are stepping in early. This structure often precedes a sharp upside breakout, signaling trend strength rather than weakness.
For a detailed view and more analysis like this, you may want to join our live webinar today on Monday January 05 2026 @ 15.00CET: DIRECT LINK
More By This Author:
NZD/USD Update: Kiwi Is Looking For More Upside After A Correction
DAX Rebound Signals Potential Upside After Key Support Hold
Visa: Completing Correction, Upside Potential Ahead


