
EURUSD – Bulls Are Breaking Out From The Wedge
Yesterday’s Summary
As discussed on the Yesterday’s analysis about price closing above resistance level that is what happened.
Price have closed above resistance level 1.09860 and it pulled back to the first support level at 1.0931. Price closing above resistance level suggest that the bulls are winning in the battle against bears.
While the price could not stay and defend that close above resistance it is not clear will they manage to push the price higher to the larger resistance level at 1.10373. We need more bull strength to verify break above.
(Click on image to enlarge)
Today’s EURUSD Chart Forecast
While the price was pulled back down to the support area we need to see price making bullish price action signal.
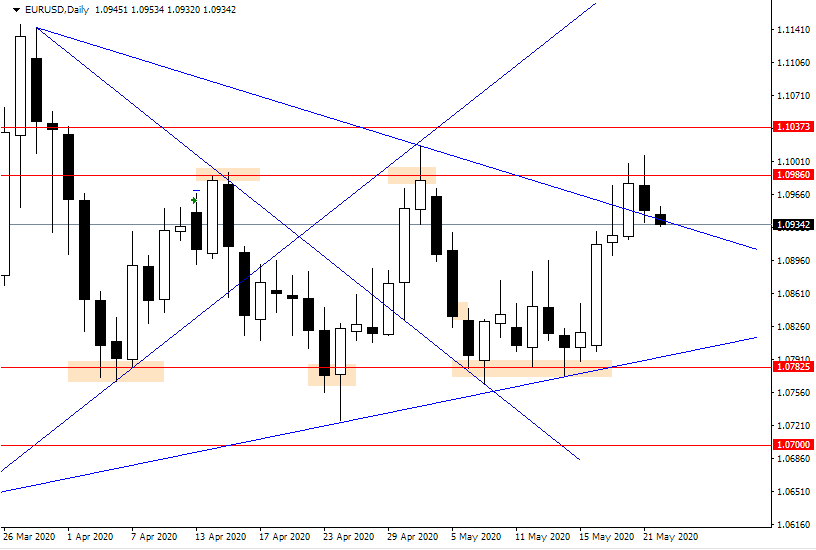
If you take a closer look on a daily chart, I have drawn daily trend line that make a wedge pattern. That pattern have a bullish breakout with pullback. Everything looks like a potential bull breakout with small pullback.
So, to verify that bull breakout we need some sort of the signal that will point us to buy the pair.
(Click on image to enlarge)
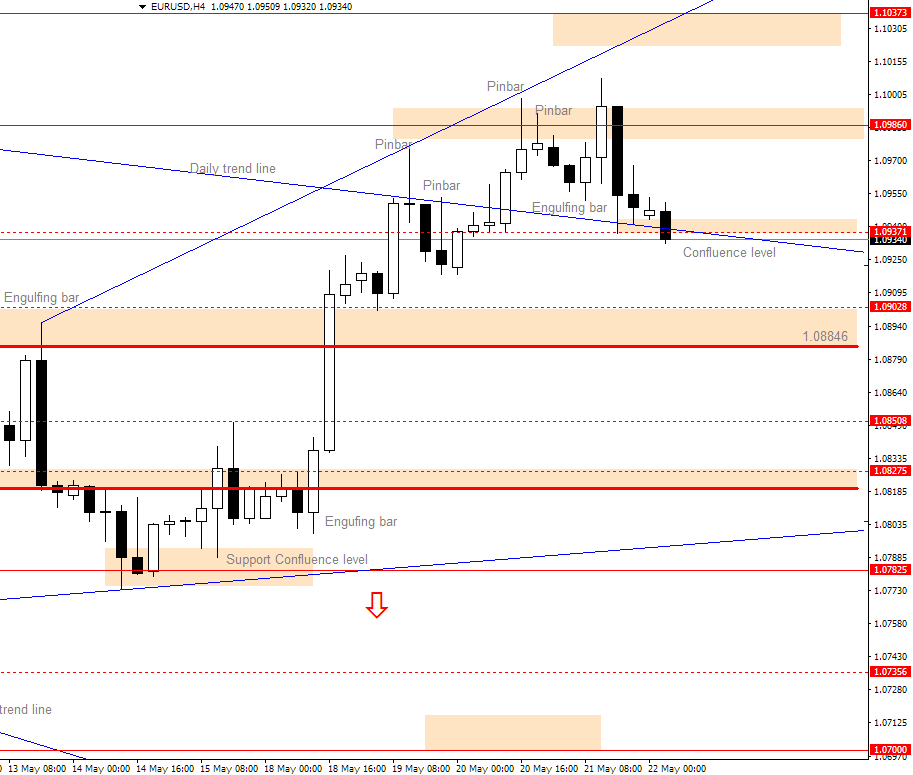
EURUSD Chart – Bullish Scenario
Last few H4 sessions have shown bull strength which was rejected with bearish Pinbar’s. But the price managed to break above resistance line.
The price is currently on the confluence support level where H4 support level and daily trend line cross.
That area acts like a strong support where the price could make a decision will it make a bullish price action and confirm breakout to upper side or it will get back down inside wedge.
If the price breaks below confluence level and then make a push back up with bullish price action that will be the signal that the price is moving further up.
First level that must be broken it the resistance level 1.09860 before moving move higher to the 1.10373 level.
EURUSD Chart – Bearish Scenario
While the bears could not hold the price inside wedge pattern it could be that bears have lost this battle and they need to shift their fight on the upper levels.
If they manage to push the price back to the first support level which is upper side of the previous range area, 1.09028 level, we could have a possible bearish scenario.
If they manage to push the price below from there we will need to see what will happen to make a further decision.
When breakout happens, in our case it is bullish breakout, it can happen that it is false breakout.
To avoid being trapped we need to wait for the price to make a retrace from the breakout and then make a price action signal that will verify breakout.
Currently we are in this situation so it is smart to wait.
One important thing is that today is Friday and it is the day when usual signal could be false signal because of traders getting out from the market at the end of the trading week.
So, be careful when selecting when to enter and on which signal.
Disclaimer: Any Advice or information is General Advice Only – It does not take into account your personal circumstances, please do not trade or invest based solely on this information. By ...
more

