EUR/JPY Sets A Late High For The Week Above 163.60 In Friday Risk Rally
Image Source: Unsplash
- The EUR/JPY followed the Friday technical rally into a new high for the week.
- The Euro pulled out of an early dip in the week, closing higher for three straight days.
- Japan inflation ticked higher on Friday, next week has Eurozone inflation in the barrel.
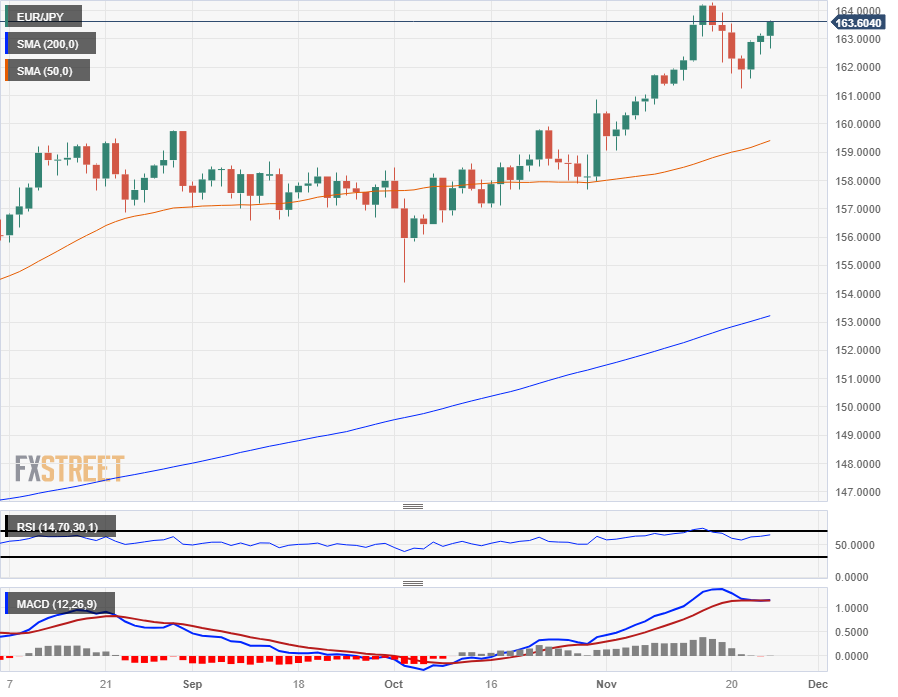
The EUR/JPY rose for the third straight trading day to chalk in a new high for the week above 163.60.
Broader markets caught a rally across the board for Friday as risk sentiment improved to close out the trading week. The Euro (EUR) caught a rise against the Japanese Yen (JPY) as risk bids buoyed assets across the board, and the Yen got pinned down by softer-than-expected National Consumer Price Index (CPI) numbers.
Japan's National CPI ticked higher for the year into October, battering the Bank of Japan's (BoJ) ongoing concerns about Japanese inflation falling too fast, too soon.
The BoJ remains concerned that Japanese price growth will eventually slump below the central bank's 2% target, but National Japanese CPI, both headline and core (excluding fresh food prices) accelerated for the annualized period into October.
National CPI printed at 3.3%, over and above September's 3%, while Nation CPI core-core (excluding both fresh food and energy prices) decreased from 4.2% top 4.0% compared to National Core CPI also rose from 2.8% to 2.9%.
With the BoJ firmly entrenched in its hyper-easy monetary policy stance, the JPY is set to take a long battering against the broader FX marketspace.
EUR/JPY Technical Outlook
The Euro remains firmly bullish against the Japanese Yen, trading into a 15-year high last week and remaining bid into the top end near 163.20.
The EUR/JPY is up over 26% against the Yen from 2023's lows at 137.38, and despite a rough consolidation period through the third quarter, remains bullish after climbing from November's lows near 159.00.
The nearest technical support is sitting at the 50-day Simple Moving Average (SMA) rising into 160.00, with the 200-day SMA trading far below price action just north of 153.00.
EUR/JPY Daily Chart
(Click on image to enlarge)

EUR/JPY Technical Levels
EUR/JPY
| OVERVIEW | |
|---|---|
| Today last price | 163.63 |
| Today Daily Change | 0.52 |
| Today Daily Change % | 0.32 |
| Today daily open | 163.11 |
| TRENDS | |
|---|---|
| Daily SMA20 | 161.5 |
| Daily SMA50 | 159.29 |
| Daily SMA100 | 158.24 |
| Daily SMA200 | 153.13 |
| LEVELS | |
|---|---|
| Previous Daily High | 163.2 |
| Previous Daily Low | 162.44 |
| Previous Weekly High | 164.31 |
| Previous Weekly Low | 161.54 |
| Previous Monthly High | 160.85 |
| Previous Monthly Low | 154.39 |
| Daily Fibonacci 38.2% | 162.91 |
| Daily Fibonacci 61.8% | 162.73 |
| Daily Pivot Point S1 | 162.64 |
| Daily Pivot Point S2 | 162.16 |
| Daily Pivot Point S3 | 161.88 |
| Daily Pivot Point R1 | 163.39 |
| Daily Pivot Point R2 | 163.67 |
| Daily Pivot Point R3 | 164.15 |
More By This Author:
Silver Sees Late Jump On Friday, Touches 12-Week High At $24.30
US Dollar Sideways Ahead Of US PMI Data On This Black Friday
USD/CAD Price Analysis: Trims Intraday Gains, Moves Below 1.3700
Disclosure: Information on this article contains forward-looking statements that involve risks and uncertainties. Markets and instruments profiled on this page are for informational purposes ...
more


