Silver Sees Late Jump On Friday, Touches 12-Week High At $24.30

Image Source: Pixabay
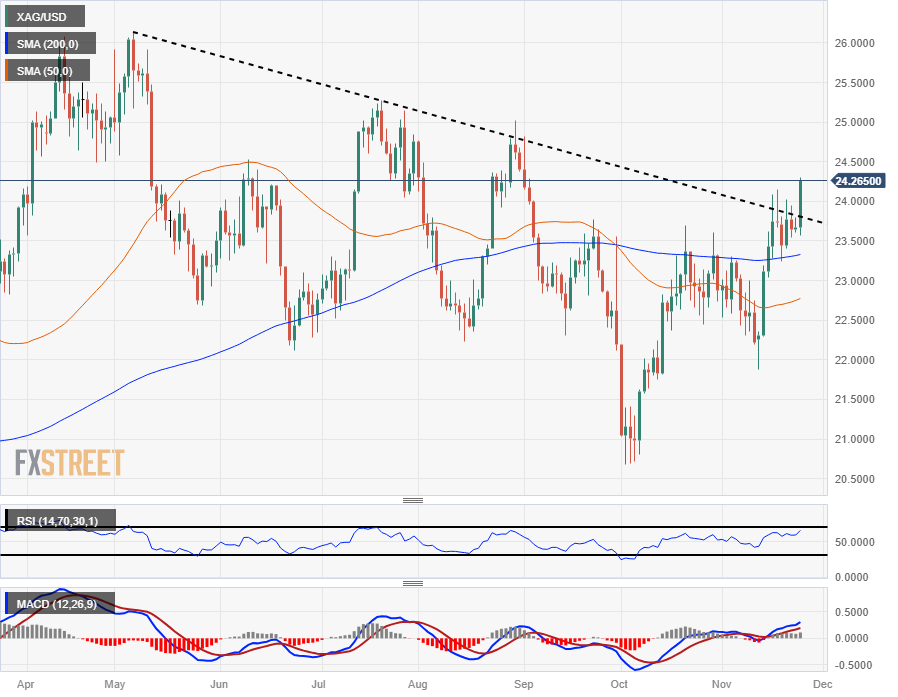
XAG/USD tapped $24.30 in the back half of Friday's trading, testing Silver's highest bids in almost 12 weeks. Market sentiment is testing higher heading into the trading week's close, and markets are set to see an early drop in trading volumes.
Wall Street will be going dark a little bit early today, with US markets slated to shut down at 13:00 EST.
Volumes and overall price momentum, already thin on Fridays, is expected to dry up a little bit earlier than usual this week.
Silver is getting bid out of a recent near-term consolidation range, and has gained almost 18% despite seeing an overall downtrend in 2023.
Friday's late bump in the XAG/USD sees Spot Silver trading into overall positive territory for the year since declining from September's peak at $25.00.
XAG/USD Technical Outlook
Friday's surge back over $24.20 sees XAG/USD making a break of a descending trendline from May's peaks above $26.00, and Silver is making a break away from the 200-day Simple Moving Average (SMA) near $23.25.
The 50-day SMA is rotating into a bullish stance from $22.75, and a bullish crossover of the longer moving average could see technical support firm up for a longer-term move higher in the bids.
Should bearish price momentum return to the fold, a downside break of $23.50 will harden the descending trendline and set up Silver bears for a fresh run at the last swing low into the $22.00 handle.
XAG/USD Daily Chart
(Click on image to enlarge)

XAG/USD Technical Levels
XAG/USD
| OVERVIEW | |
|---|---|
| Today last price | 24.26 |
| Today Daily Change | 0.59 |
| Today Daily Change % | 2.49 |
| Today daily open | 23.67 |
| TRENDS | |
|---|---|
| Daily SMA20 | 23.1 |
| Daily SMA50 | 22.75 |
| Daily SMA100 | 23.24 |
| Daily SMA200 | 23.32 |
| LEVELS | |
|---|---|
| Previous Daily High | 23.79 |
| Previous Daily Low | 23.6 |
| Previous Weekly High | 24.15 |
| Previous Weekly Low | 21.88 |
| Previous Monthly High | 23.7 |
| Previous Monthly Low | 20.68 |
| Daily Fibonacci 38.2% | 23.72 |
| Daily Fibonacci 61.8% | 23.67 |
| Daily Pivot Point S1 | 23.58 |
| Daily Pivot Point S2 | 23.5 |
| Daily Pivot Point S3 | 23.39 |
| Daily Pivot Point R1 | 23.78 |
| Daily Pivot Point R2 | 23.88 |
| Daily Pivot Point R3 | 23.97 |
More By This Author:
US Dollar Sideways Ahead Of US PMI Data On This Black Friday
USD/CAD Price Analysis: Trims Intraday Gains, Moves Below 1.3700
Silver Price Analysis: XAG/USD Consolidates Near $23.65 Area, Below Descending Trend-Line Hurdle
Disclosure: Information on this article contains forward-looking statements that involve risks and uncertainties. Markets and instruments profiled on this page are for informational purposes ...
more


