

Image Source: Pixabay
- Silver oscillates in a narrow trading band for the second successive day on Friday.
- Bullish oscillators on the daily chart support prospects for some short-term gains.
- A breakout through an ascending trend line is needed to confirm the bullish bias.
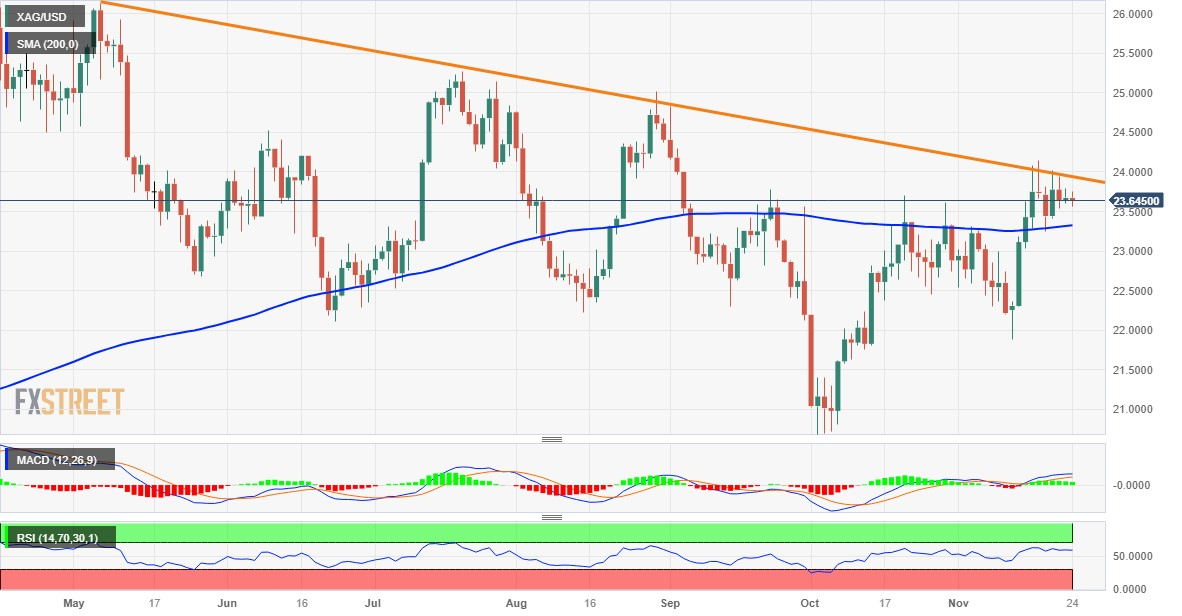
Silver (XAG/USD) continues with its struggle to gain any meaningful traction and seesaws between tepid gains/minor losses for the second successive day on Friday. The white metal currently trades around the $23.65 region, nearly unchanged for the day and below a downward-sloping trend line resistance extending from the May swing high.
The aforementioned barrier, currently pegged near the $24.00 round figure, should act as a key pivotal point and help determine the next leg of a directional move for the XAG/USD. Against the backdrop of the recent sustained strength beyond the 200-day Simple Moving Average (SMA), positive oscillators on the daily chart support prospects for an eventual breakout through the said resistance.
A sustained strength beyond will be seen as a fresh trigger for bulls. The subsequent move-up should allow the XAG/USD to surpass the $24.20-$24.25 intermediate hurdle and make a fresh attempt to conquer the $25.00 psychological mark. Some follow-through buying beyond the $25.15-$25.20 region will set the stage for a move towards reclaiming the $26.00 mark for the first time since May.
On the flip side, the 200-day SMA, currently around the $23.35 region, might continue to protect the immediate downside. Any further decline might still be seen as a buying opportunity and remain limited near the $23.00 mark. A convincing break below the latter, however, might prompt aggressive technical selling and drag the XAG/USD towards the $22.35-$22.30 zone en route to the $22.00 mark.
Silver daily chart
(Click on image to enlarge)
Technical levels to watch
XAG/USD
| OVERVIEW | |
|---|---|
| Today last price | 23.66 |
| Today Daily Change | -0.01 |
| Today Daily Change % | -0.04 |
| Today daily open | 23.67 |
| TRENDS | |
|---|---|
| Daily SMA20 | 23.1 |
| Daily SMA50 | 22.75 |
| Daily SMA100 | 23.24 |
| Daily SMA200 | 23.32 |
| LEVELS | |
|---|---|
| Previous Daily High | 23.79 |
| Previous Daily Low | 23.6 |
| Previous Weekly High | 24.15 |
| Previous Weekly Low | 21.88 |
| Previous Monthly High | 23.7 |
| Previous Monthly Low | 20.68 |
| Daily Fibonacci 38.2% | 23.72 |
| Daily Fibonacci 61.8% | 23.67 |
| Daily Pivot Point S1 | 23.58 |
| Daily Pivot Point S2 | 23.5 |
| Daily Pivot Point S3 | 23.39 |
| Daily Pivot Point R1 | 23.78 |
| Daily Pivot Point R2 | 23.88 |
| Daily Pivot Point R3 | 23.97 |
More By This Author:
USD/CHF Consolidates Ahead Of US PMI Data, Remains Below 0.8850AUD/USD Consolidates Its Gains Around 0.6560 Ahead Of The US PMI Data
USD/JPY Fails To Hold Momentum And Trims Daily Losses


Comments
Log in or sign up to join the conversation.