

Image Source: Unsplash
EUR/GBP is coming lower after UK CPI inflation data and ECB Cut last week as mentioned and highlighted on May 24.
(Click on image to enlarge)
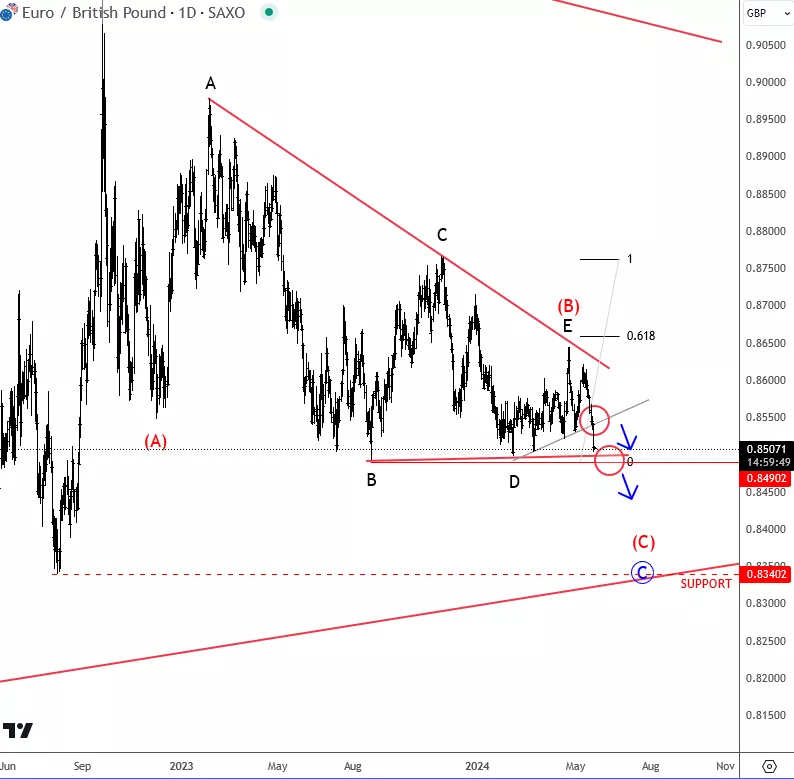
EUR/GBP Daily Chart From May 24, 2024
As you can see today after two weeks, EUR/GBP is nicely breaking out of the projected wave (B) bearish triangle pattern, so wave (C) of C can now be in progress with room down to the lower triangle line near 0.84 - 0.83 support area, from where we will have to be aware of bounce and recovery.
(Click on image to enlarge)
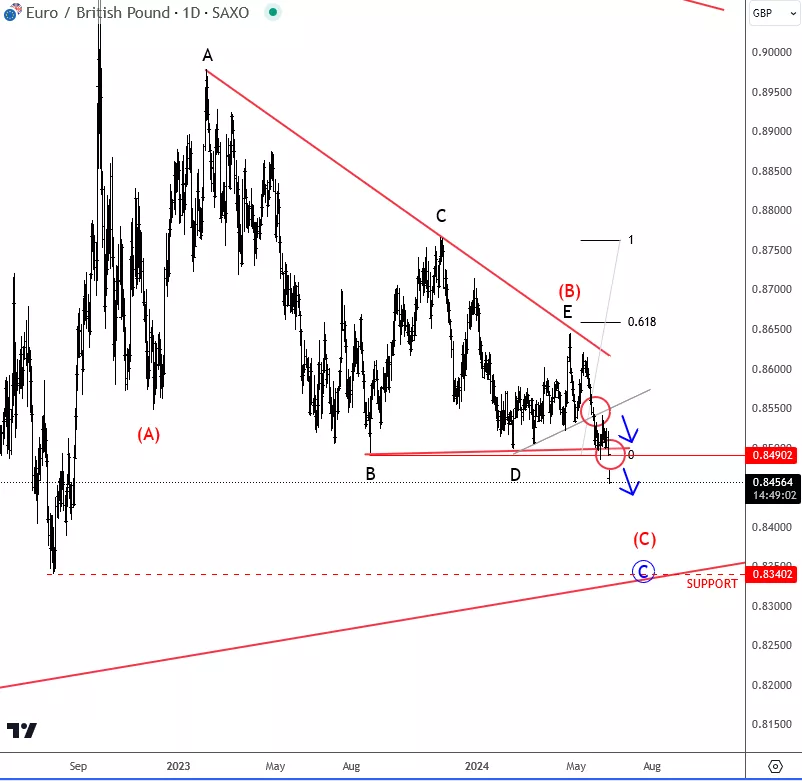
EUR/GBP Daily Chart From June 10, 2024
More By This Author:
Binance Coin Is Back To All-Time Highs As Anticipated
Stocks Bounce, As S&P 500 Can Be Progressing 5th Wave
U.S. Yields Could Be Back In The Downtrend


Comments
Log in or sign up to join the conversation.