
USDJPY Elliott Wave Analysis – Trading Lounge
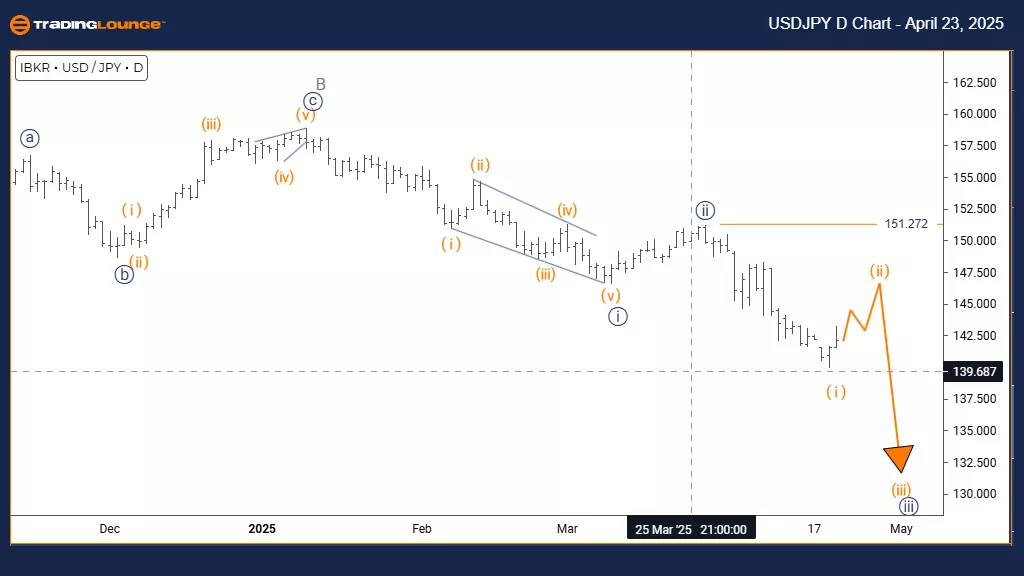
U.S. Dollar / Japanese Yen (USDJPY) – Day Chart
USDJPY Elliott Wave Technical Analysis
Function: Counter Trend
Mode: Corrective
Structure: Orange wave 2
Position: Navy blue wave 3
Direction Next Lower Degrees: Orange wave 3
Details: Orange wave 1 appears complete, with orange wave 2 now unfolding.
Wave Cancel Invalid Level: 151.272
The USDJPY daily chart indicates a corrective counter-trend within a broader bullish framework. Orange wave 1’s upward impulse appears completed, and orange wave 2 is now unfolding within the context of navy blue wave 3’s larger uptrend. This phase implies a temporary retracement before the bullish trend potentially resumes.
Orange wave 2 typically retraces 38% to 61% of wave 1’s move. Its overlapping structure and weaker momentum are hallmarks of a standard correction. On this daily timeframe, it may mark a mid-term pause in an overall bullish sequence.
Once wave 2 completes, orange wave 3 is expected to begin—a strong impulsive leg that may exceed wave 1’s high. The 151.272 level remains critical; any move below invalidates this wave count. Traders should look for signs of a reversal—bullish candles and oversold indicators—to signal wave 3’s onset.
This correction serves as a healthy consolidation within the broader uptrend, giving traders a moment to plan. Key Fibonacci levels will help identify high-probability entries as the structure transitions from wave 2 to wave 3.
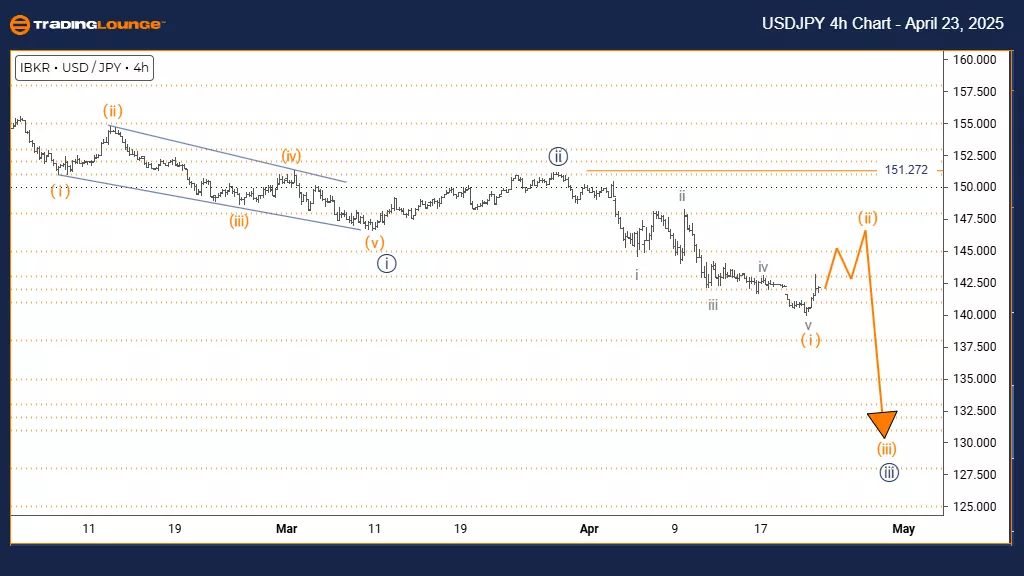
U.S. Dollar / Japanese Yen (USDJPY) – 4 Hour Chart
USDJPY Elliott Wave Technical Analysis
Function: Counter Trend
Mode: Corrective
Structure: Orange wave 2
Position: Navy blue wave 3
Direction Next Lower Degrees: Orange wave 3
Details: Orange wave 1 looks completed, and orange wave 2 is now developing.
Wave Cancel Invalid Level: 151.272
The USDJPY 4-hour chart highlights a corrective counter-trend forming within a broader bullish pattern. Orange wave 1 has completed its upward run, and orange wave 2 has commenced its corrective phase within the context of navy blue wave 3’s larger uptrend. This phase indicates a short-term pullback before the potential continuation of the bullish move.
Orange wave 2 commonly retraces 38% to 61% of wave 1’s advance and is marked by overlapping price structures and reduced momentum. This short-term consolidation aligns with standard corrective behavior. It sets the stage for the next impulse wave—orange wave 3—which often becomes the most dynamic phase in the pattern.
Wave 3 is expected to extend strongly beyond wave 1’s high once wave 2 ends. The key invalidation point remains at 151.272; a move below this would void the current wave outlook. Traders should watch for traditional reversal signals and oversold readings to confirm wave 2’s end and the onset of wave 3.
This current pullback is typical within a trending market and offers traders an opportunity to reassess and position for the next bullish phase. Monitoring price reaction at Fibonacci levels is essential for identifying entry opportunities as the market transitions from wave 2 to wave 3.
Technical Analyst: Malik Awais
More By This Author:
Elliott Wave Technical Analysis: Ripple Crypto Price News For Wednesday, April 23
Elliott Wave Technical Analysis: Computershare Limited
Elliott Wave Technical Analysis: Fortinet Inc. - Tuesday, April 22


Comments
Log in or sign up to join the conversation.